第 7 章:可观测性 - 理解服务的行为
本文系统梳理了 Istio 服务网格的可观测性原理与实践,涵盖指标采集、Prometheus 集成、自定义遥测等关键能力,帮助云原生团队高效理解和监控服务行为。
可观测性基础与 Istio 优势
可观测性是通过外部信号理解系统内部状态的能力,是现代微服务架构下保障系统稳定与高效运维的核心。Istio 通过数据平面代理(Envoy)天然处于服务间流量,能够无侵入地采集丰富的网络与应用层指标,为服务治理和问题定位提供基础。
可观测性与监控的区别
监控侧重于已知故障的检测与告警,而可观测性关注于通过丰富数据发现未知问题。Istio 采集的指标不仅支持常规监控,还能为复杂场景下的根因分析和用户体验追踪提供数据支撑。
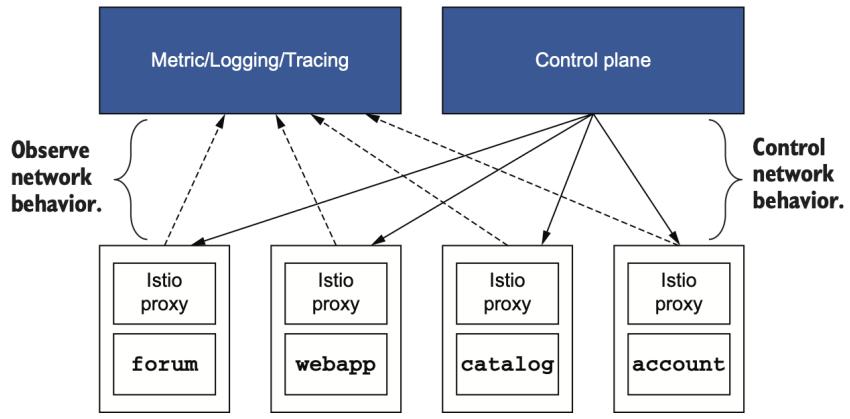
Istio 数据平面与控制平面指标
Istio 数据平面(Envoy 代理)和控制平面(istiod)均暴露了丰富的指标,便于多维度观测服务网格运行状态。
数据平面指标采集
每个注入 Sidecar 的 Pod 都可通过 15000 端口访问 Envoy 管理接口,获取连接、请求、熔断等详细指标。例如:
kubectl exec -it deploy/webapp -c istio-proxy -- curl localhost:15000/stats
常见指标包括:
| 指标 | 描述 |
|---|---|
| istio_requests_total | 请求总数 |
| istio_request_duration_milliseconds | 请求耗时 |
| istio_request_bytes | 请求体字节数 |
| istio_response_bytes | 响应体字节数 |
| istio_request_messages_total | gRPC 请求消息数 |
| istio_response_messages_total | gRPC 响应消息数 |
可通过注解 proxy.istio.io/config 或全局 MeshConfig 配置,灵活调整代理上报的指标范围。
控制平面指标采集
控制平面(istiod)通过 15014 端口暴露自身性能与健康指标:
kubectl exec -it -n istio-system deploy/istiod -- curl localhost:15014/metrics
关键指标包括:
- pilot_proxy_convergence_time:配置下发延迟
- pilot_services:已知服务数量
- pilot_xds_pushes:xDS 配置推送次数
Prometheus 集成与指标可视化
Prometheus 作为主流时序数据库,支持拉取 Istio 代理和控制平面暴露的指标。通过 ServiceMonitor、PodMonitor 等 CRD,可灵活配置采集目标。
配置示例
ServiceMonitor 用于采集控制平面指标:
apiVersion: monitoring.coreos.com/v1
kind: ServiceMonitor
metadata:
  name: istio-component-monitor
  namespace: prometheus
spec:
  selector:
    matchExpressions:
      - {key: istio, operator: In, values: [pilot]}
  endpoints:
    - port: http-monitoring
      interval: 15s
PodMonitor 用于采集数据平面指标:
apiVersion: monitoring.coreos.com/v1
kind: PodMonitor
metadata:
  name: envoy-stats-monitor
  namespace: prometheus
spec:
  selector:
    matchExpressions:
      - {key: istio-prometheus-ignore, operator: DoesNotExist}
  podMetricsEndpoints:
    - path: /stats/prometheus
      interval: 15s
      relabelings:
        - action: keep
          sourceLabels: [__meta_kubernetes_pod_container_name]
          regex: "istio-proxy"
通过 Prometheus 查询界面可实时检索如 istio_requests_total、pilot_xds_pushes 等指标。
Istio 指标自定义与扩展
Istio 支持通过 Telemetry API、EnvoyFilter 等方式自定义指标维度和内容,满足企业级多样化观测需求。
增加指标维度
可通过 IstioOperator 或 Telemetry 资源为标准指标添加自定义维度:
telemetry:
  v2:
    prometheus:
      configOverride:
        inboundSidecar:
          metrics:
            - name: requests_total
              dimensions:
                upstream-proxy_version: upstream_peer.istio_version
                sourcemesh_id: node_metadata['MESH_ID']
Pod 需通过注解 sidecar.istio.io/extraStatTags 声明新维度:
metadata:
  annotations:
    proxy.istio.io/config: |-
      extraStatTags:
        - "upstream-proxy_version"
        - "sourcemesh_id"
创建自定义指标
可通过 Telemetry API 或 IstioOperator 配置自定义指标:
definitions:
  - name: get_calls
    type: COUNTER
    value: "(request.method.startsWith('GET') ? 1 : 0)"
属性生成与高级分组
结合 attribute-gen 插件,可基于请求路径、方法等生成新属性,实现更细粒度的指标分组。例如:
{
  "attributes": [
    {
      "output_attribute": "istio_operationId",
      "match": [
        { "value": "getItems", "condition": "request.url_path == '/items' && request.method == 'GET'" }
      ]
    }
  ]
}
总结
- Istio 通过 Sidecar 代理和控制平面组件,实现了服务网格的高可观测性。
- 支持标准与自定义指标采集,便于多维度监控与问题定位。
- Prometheus、Grafana 等工具可无缝集成,实现指标可视化与告警。
- Telemetry API、EnvoyFilter 等机制支持灵活扩展指标,满足企业级观测需求。
参考文献
- Istio 官方文档 - istio.io
- Envoy 统计指标 - envoyproxy.io
- Prometheus Operator - prometheus-operator.dev
- Google SRE Book - sre.google