Note: This blog is based on Envoy Gateway v1.3.2.
Observability is a foundational capability for understanding and operating microservices at scale. Envoy Gateway, built on top of Envoy Proxy, offers rich observability features for metrics, logs, and traces. This blog provides a hands-on guide to configuring observability in the data plane—that is, within the Envoy proxies themselves—using built-in telemetry and open source backends like Prometheus, Loki, and Tempo.
Prerequisites
Before exploring observability with Envoy Gateway, ensure the required setup is completed. The Envoy Gateway observability architecture is illustrated below:

OpenTelemetry Collector is a pluggable data pipeline component responsible for receiving, processing, and forwarding observability data, such as metrics and traces—from systems like Envoy Gateway. By decoupling data producers from data backends, it enables flexible integration with various observability systems (e.g., Prometheus, Tempo, Jaeger), while supporting data enrichment, format conversion, and multi-destination export.
Install Envoy Gateway
Follow the Quickstart Guide to install Envoy Gateway:
helm install eg oci://docker.io/envoyproxy/gateway-helm --version v1.3.2 -n envoy-gateway-system --create-namespace
kubectl wait --timeout=5m -n envoy-gateway-system deployment/envoy-gateway --for=condition=Available
kubectl apply -f https://github.com/envoyproxy/gateway/releases/download/v1.3.2/quickstart.yaml -n default
Install Observability Add-ons
Install observability components via the Helm chart:
helm install eg-addons oci://docker.io/envoyproxy/gateway-addons-helm --version v1.3.2 -n monitoring --create-namespace --set opentelemetry-collector.enabled=trueNote: By default, OpenTelemetry Collector is disabled. Explicitly enable it as shown above.
Installed components include:
| Component | Role | Description |
|---|---|---|
| FluentBit | Log Collector | Collects and forwards logs to Loki |
| Grafana | Visualization UI | Dashboards for metrics, logs, traces |
| Loki | Log Storage | Aggregates and indexes logs |
| OpenTelemetry Collector | Telemetry Collector | Exports metrics/traces to Prometheus/Tempo |
| Prometheus | Metrics Backend | Collects and provides metrics |
| Tempo | Traces Backend | Stores tracing data |
Generate Test Traffic
Generate test traffic to the Envoy Gateway’s external IP. Since we are using Minikube for testing, let’s use the kubectl port forward:
export ENVOY_SERVICE=$(kubectl get svc -n envoy-gateway-system --selector=gateway.envoyproxy.io/owning-gateway-namespace=default,gateway.envoyproxy.io/owning-gateway-name=eg -o jsonpath='{.items[0].metadata.name}')
kubectl port-forward -n envoy-gateway-system svc/${ENVOY_SERVICE} 8888:80
curl --verbose --header "Host: www.example.com" http://localhost:8888/get
Metrics
Disable default Prometheus metrics and enable OpenTelemetry sink:
cat <<EOF | kubectl apply -f -
apiVersion: gateway.networking.k8s.io/v1
kind: Gateway
metadata:
name: eg
namespace: envoy-gateway-system
spec:
gatewayClassName: eg
infrastructure:
parametersRef:
group: gateway.envoyproxy.io
kind: EnvoyProxy
name: unified-telemetry
listeners:
- name: http
protocol: HTTP
port: 80
---
apiVersion: gateway.envoyproxy.io/v1alpha1
kind: EnvoyProxy
metadata:
name: unified-telemetry
namespace: envoy-gateway-system
spec:
telemetry:
metrics:
prometheus:
disable: true
sinks:
- type: OpenTelemetry
openTelemetry:
host: otel-collector.monitoring.svc.cluster.local
port: 4317
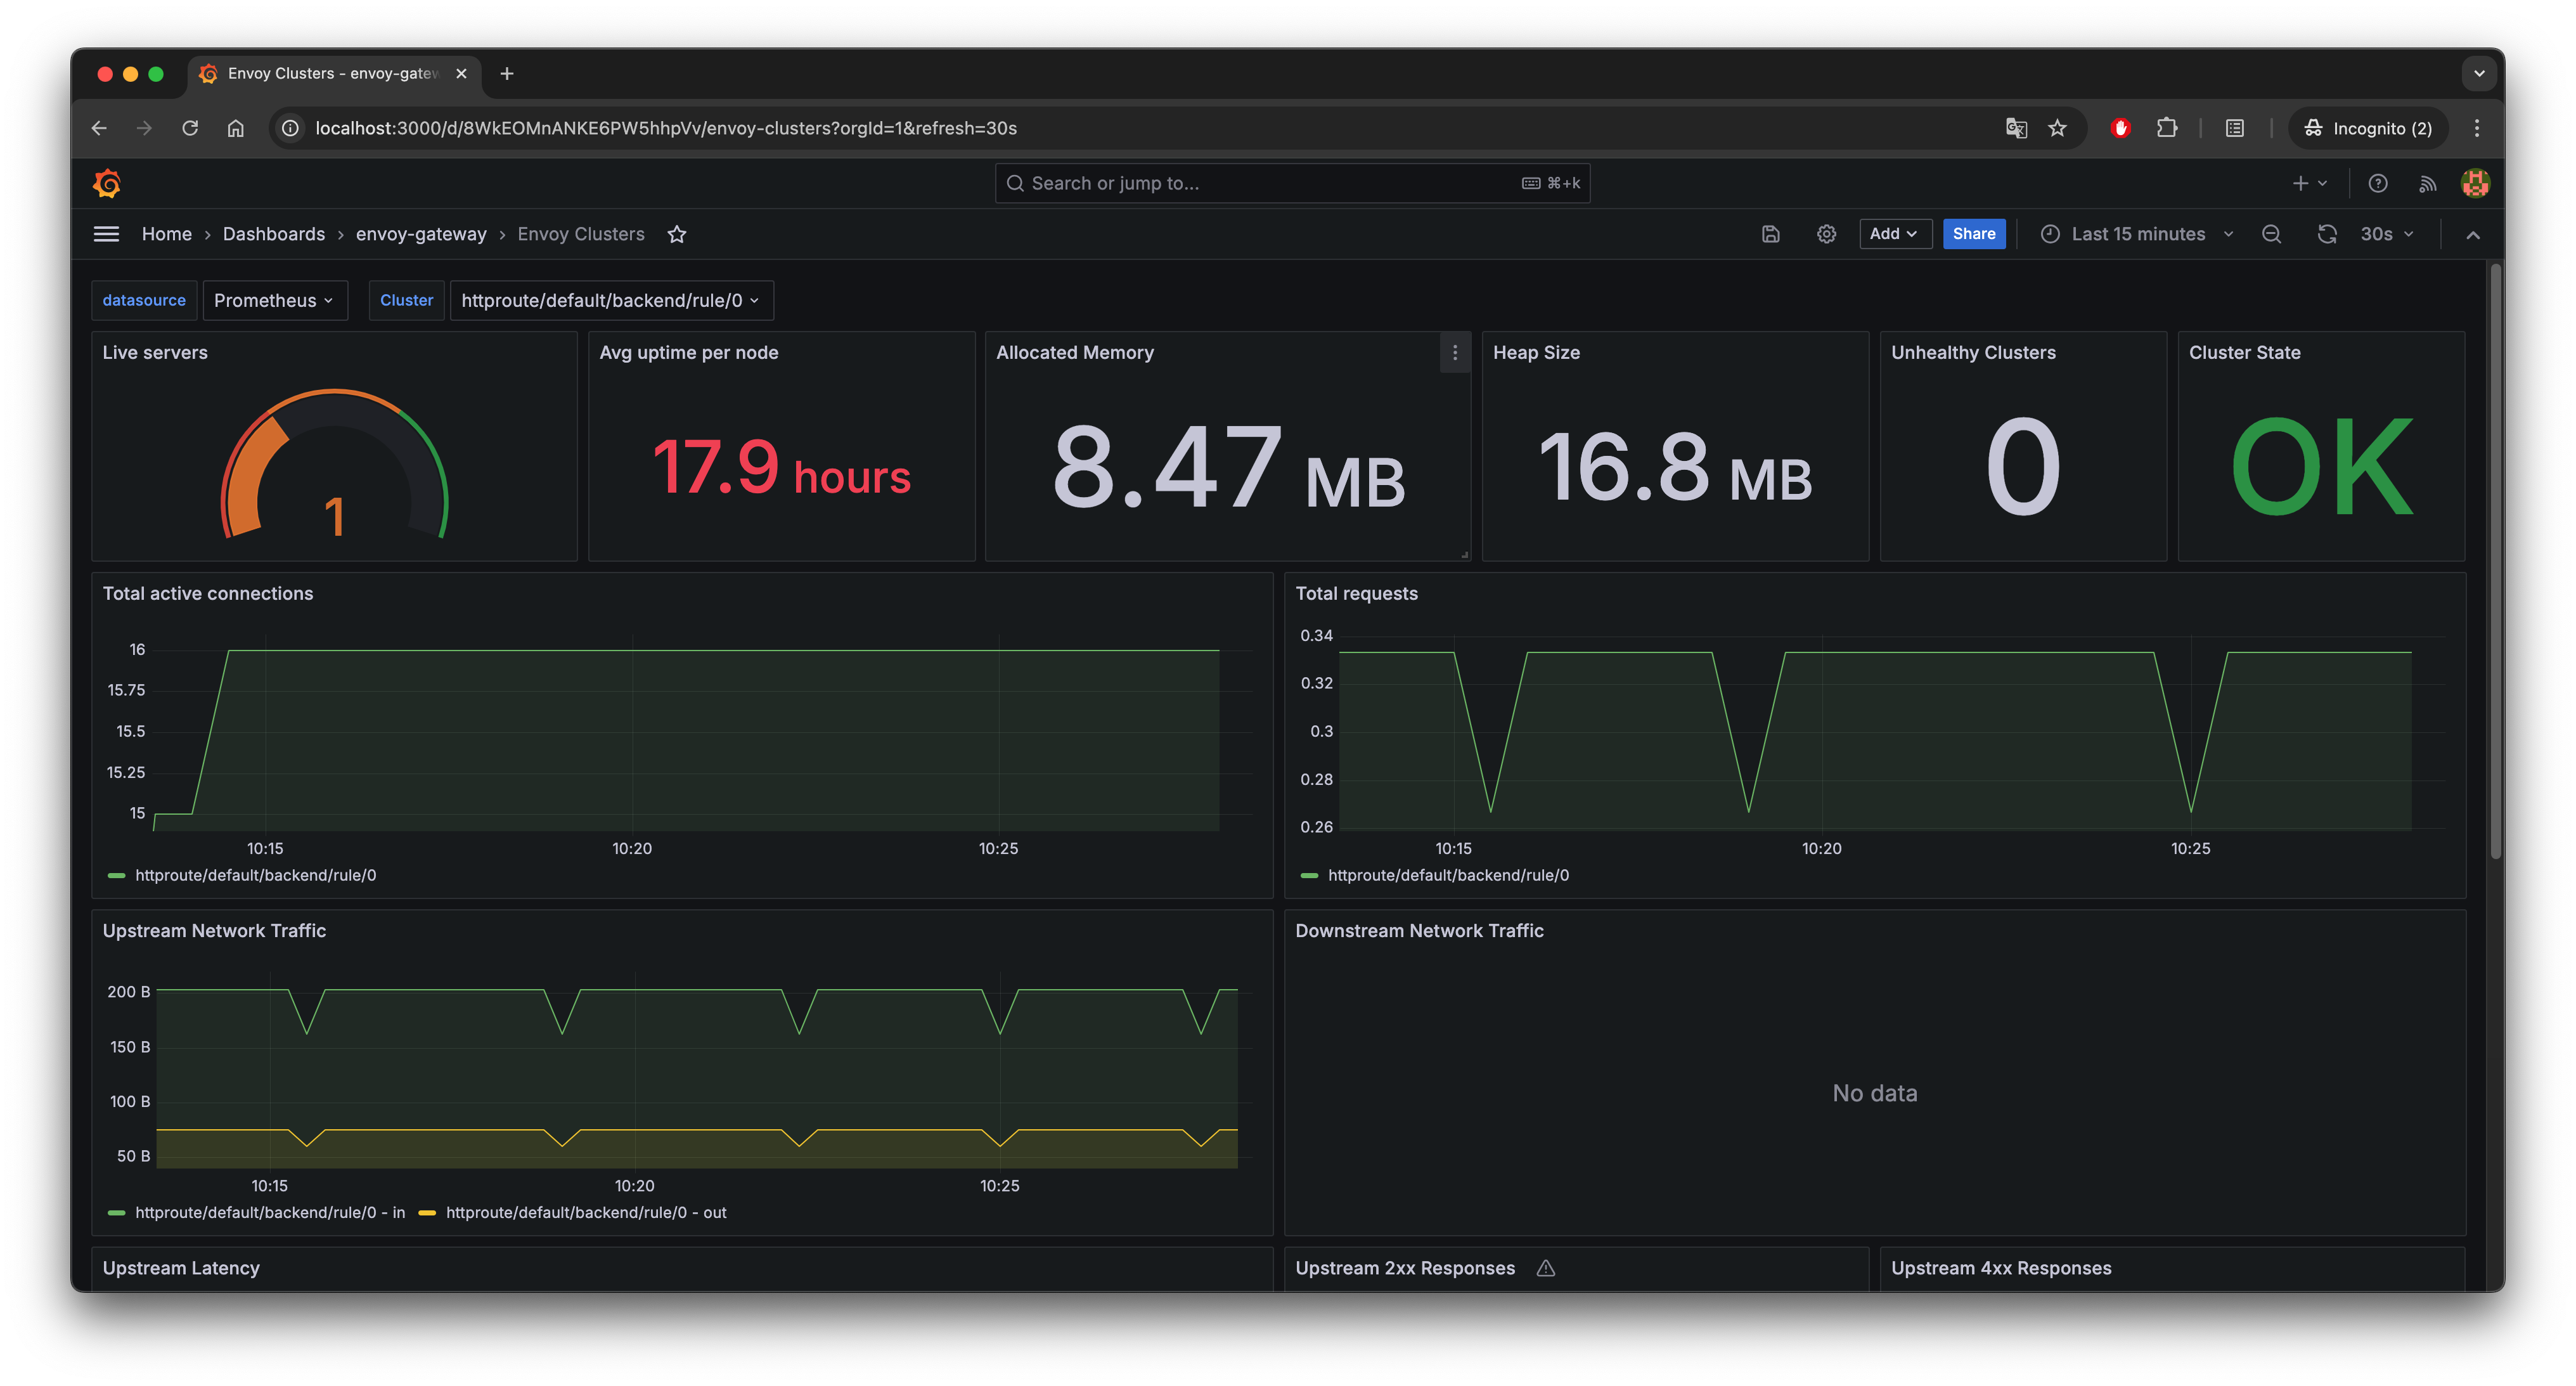
EOFThis diagram illustrates the metrics observability pipeline of Envoy Proxy: Envoy natively collects key metrics such as network traffic and exposes them via the /stats/prometheus endpoint for Prometheus to scrape. The collected data can then be visualized in Grafana. Additionally, Envoy supports custom metrics and can optionally integrate with backends like StatsD, enabling a flexible and extensible monitoring architecture.

Explore Metrics
Expose and query Prometheus:
kubectl port-forward -n monitoring svc/prometheus 9090:80Visit http://localhost:9090 and query metrics:
topk(1,envoy_cluster_upstream_cx_connect_ms_sum)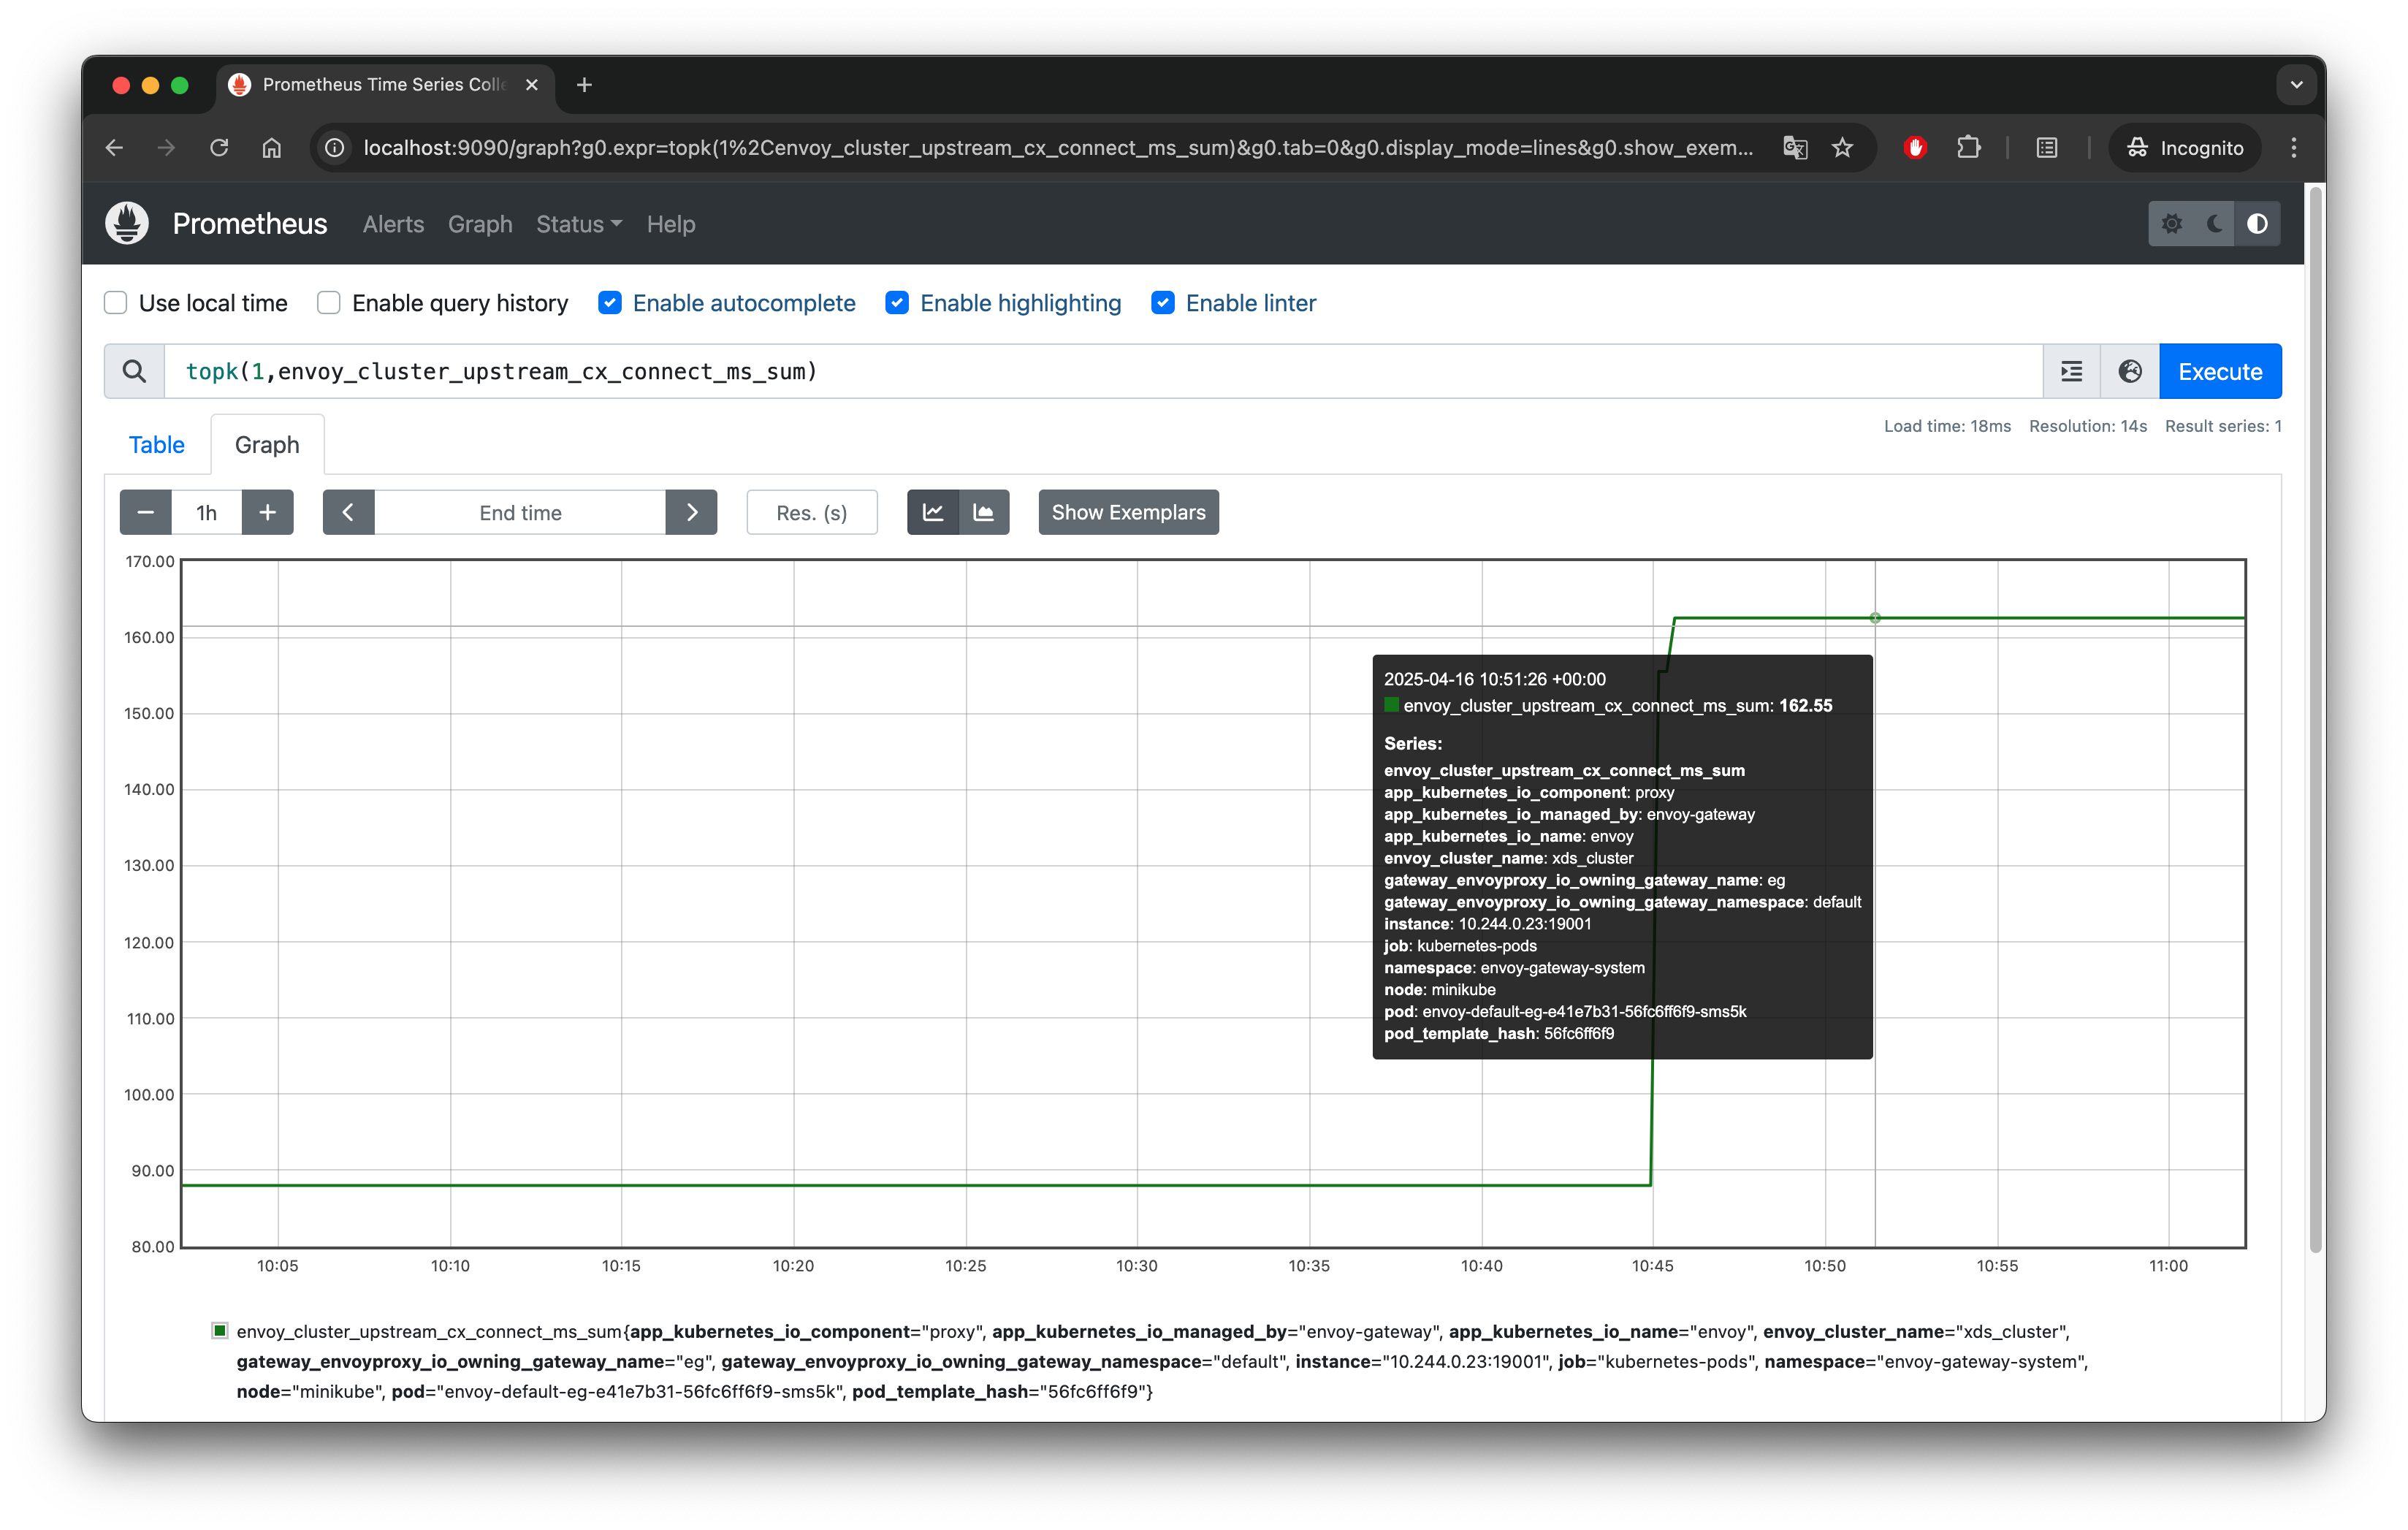
Expose Grafana UI:
kubectl port-forward -n monitoring svc/grafana 3000:80Open http://localhost:3000, and the default account password is admin/admin.
Visit the proxy metrics guide to learn more about metrics configuration in Envoy Gateway.
Logs
Envoy Gateway utilizes access logging, configurable in formats and destinations.
Configure the Envoy Gateway to send logs to the OpenTelemetry sink:
kubectl apply -f https://raw.githubusercontent.com/envoyproxy/gateway/refs/heads/main/examples/kubernetes/accesslog/otel-accesslog.yamlCheck the logs stored in Loki via the OpenTelemetry Sink.
curl -s "http://localhost:3100/loki/api/v1/query_range" --data-urlencode "query={exporter=\"OTLP\"}" | jq '.data.result[0].values'The output will look similar to this:
[
  [
    "1693314563284333000",
    "{"body":"[2025-04-17T13:09:23.284Z] "- - HTTP/1.1" 400 DPE 0 11 0 "-" "-" "-" "-" "-"\\n","resources":{"cluster_name":"default/eg","k8s.cluster.name":"cluster-1","log_name":"otel_envoy_accesslog","node_name":"envoy-default-eg-64656661-6fccffddc5-662np","zone_name":""}}"
  ]
 ...
]
This diagram illustrates how Envoy Gateway handles access logs for observability. It supports configurable log formats, multiple output targets (such as stdout, file, syslog, or HTTP), optional filtering and sampling to reduce log volume, and the ability to include security-related information for auditing purposes.

Visit the Proxy Access Logs guide to learn more about log configuration in Envoy Gateway.
Explore Logs with Grafana
To view Envoy Gateway logs in Grafana, first port-forward the Grafana service:
kubectl port-forward -n monitoring svc/grafana 3000:80Then open your browser and navigate to: http://localhost:3000. The default login credentials are admin/admin, and you’ll be prompted to change the password on first login.
After logging in, go to the Data sources section from the left sidebar and verify that a data source named loki is configured with the URL http://loki:3100.
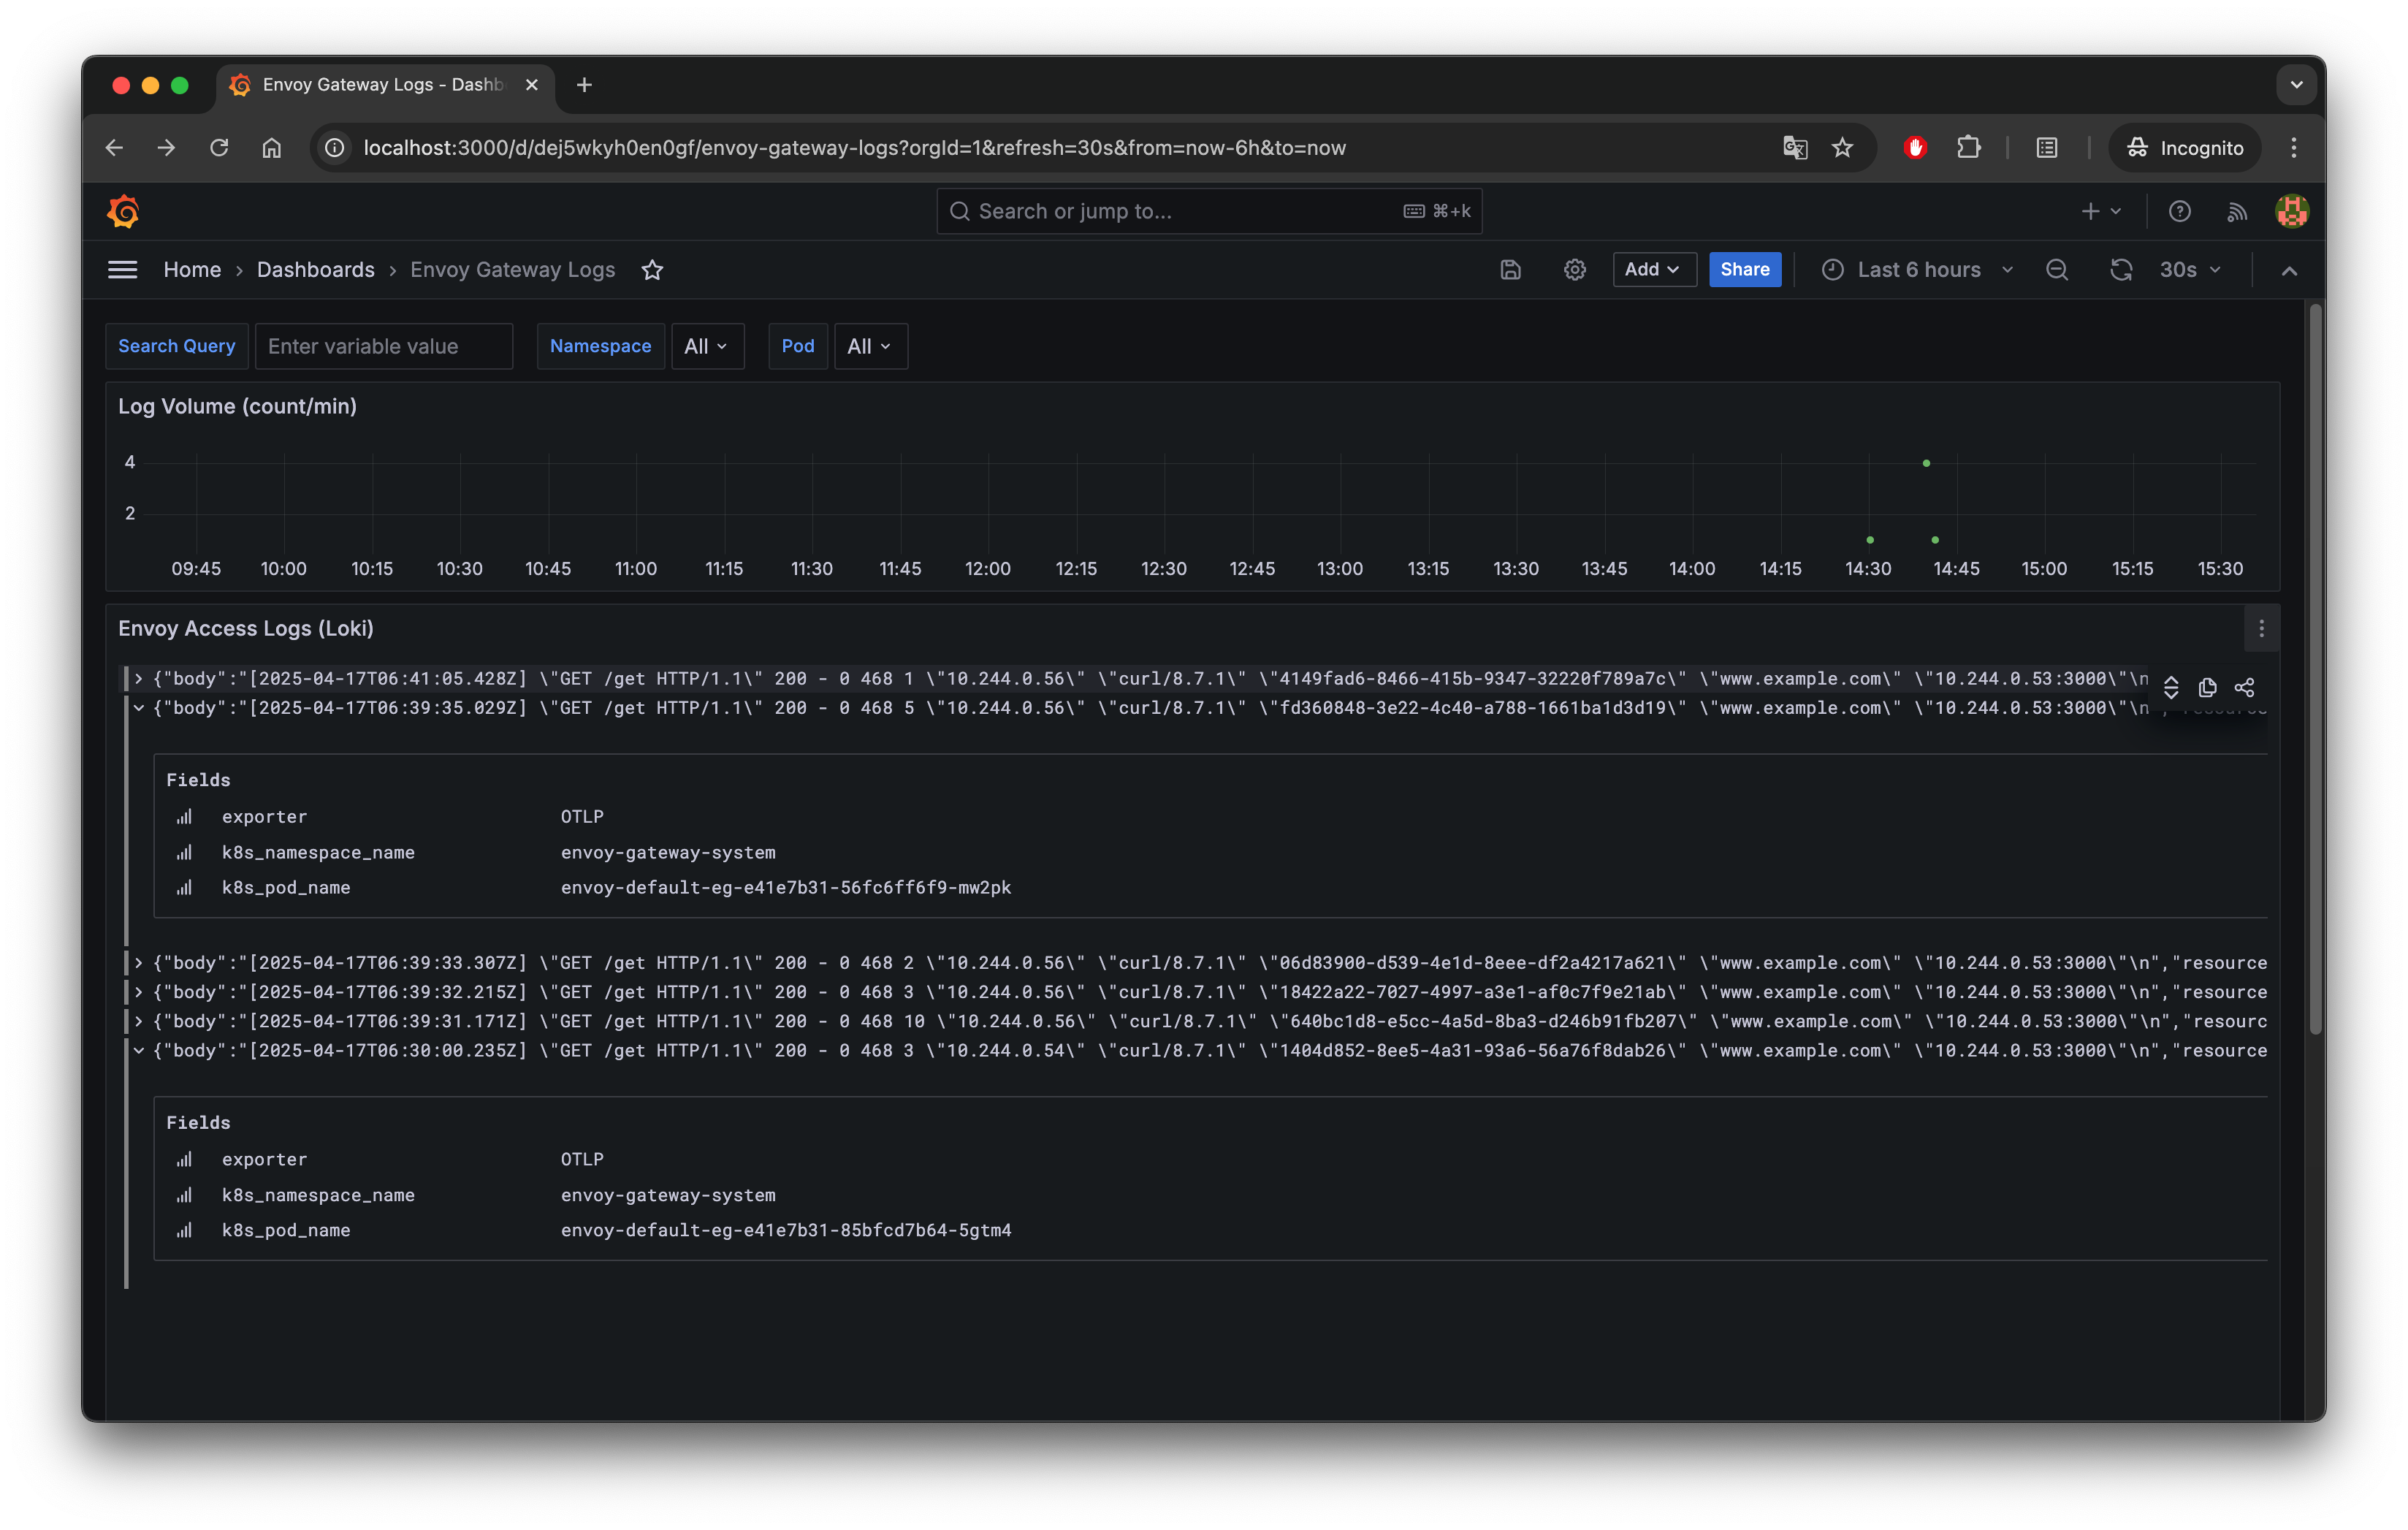
Next, download and import the following dashboard JSON into Grafana: envoy-gateway-logs-dashboard.json
Once imported, open the Envoy Gateway Logs dashboard to explore and filter log entries.
Traces
Tracing provides detailed request journeys. Envoy Gateway supports OpenTelemetry for tracing. Envoy generates trace data containing Trace ID and Span ID. The data can be sent to OpenTelemetry, Zipkin, or other backends that support OpenTracing through configuration. Users set the backend address and format in the configuration file and enable the tracing function.
Enable tracing in CRD:
kubectl apply -f https://raw.githubusercontent.com/envoyproxy/gateway/refs/heads/main/examples/kubernetes/tracing/default.yamlVerify traces with Tempo:
kubectl port-forward svc/tempo 3100:3100 -n monitoring
curl -s "http://localhost:3100/api/search" --data-urlencode "q={ component=envoy }" | jq .traces
You will see output similar to this:
[
  {
   "traceID": "8010d4fd89e024c0626d984621babd71",
   "rootServiceName": "eg.default",
   "rootTraceName": "ingress",
   "startTimeUnixNano": "1693377719403756000"
  }
  ...
]
Search for the specific trace ID:
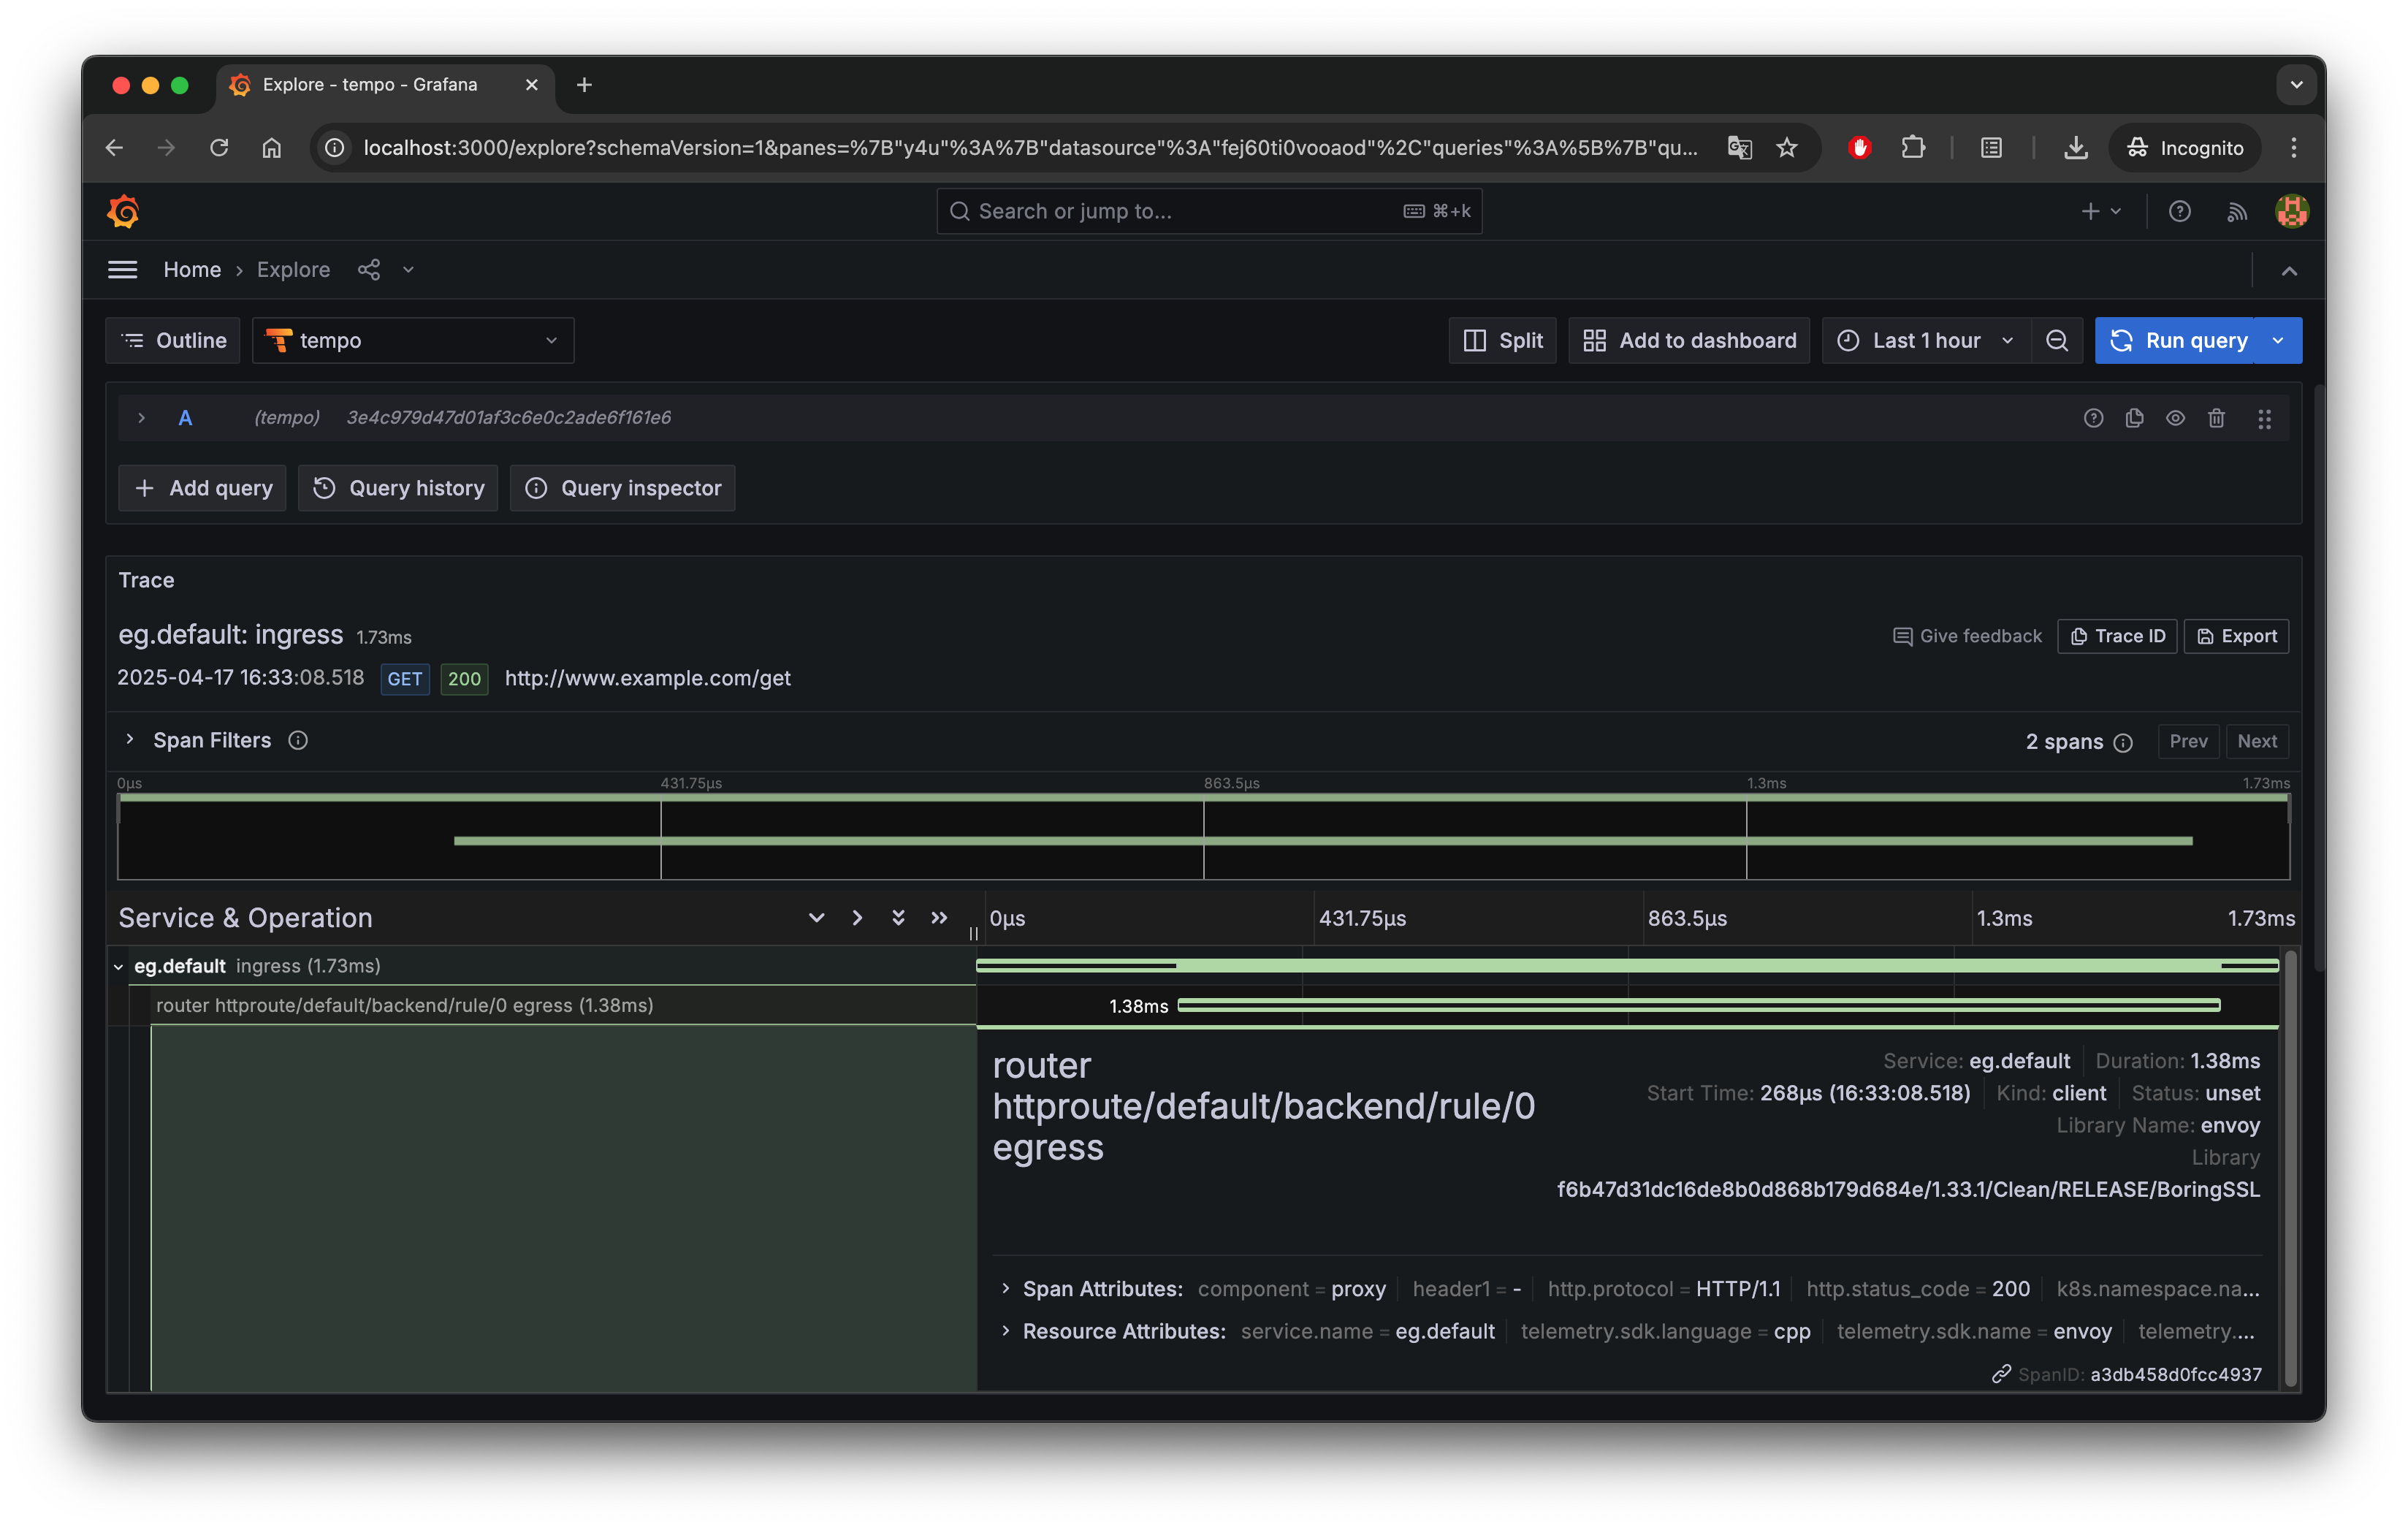
curl -s "http://localhost:3100/api/traces/<trace_id>" | jqThese traces provide detailed information about a request’s journey through Envoy Gateway, including start and end times, trace and span IDs, service and operation names, attributes, and more.
Visit the Proxy Tracing guide to learn more about tracing configuration in Envoy Gateway.
Explore Traces with Grafana
After logging into Grafana, go to Data sources from the left sidebar and ensure a Tempo data source is configured with the name tempo and the URL http://tempo:3100.
To explore trace data:
- Import the dashboard JSON: envoy-gateway-traces-dashboard.json
- Open the Envoy Gateway Traces dashboard to browse trace entries.
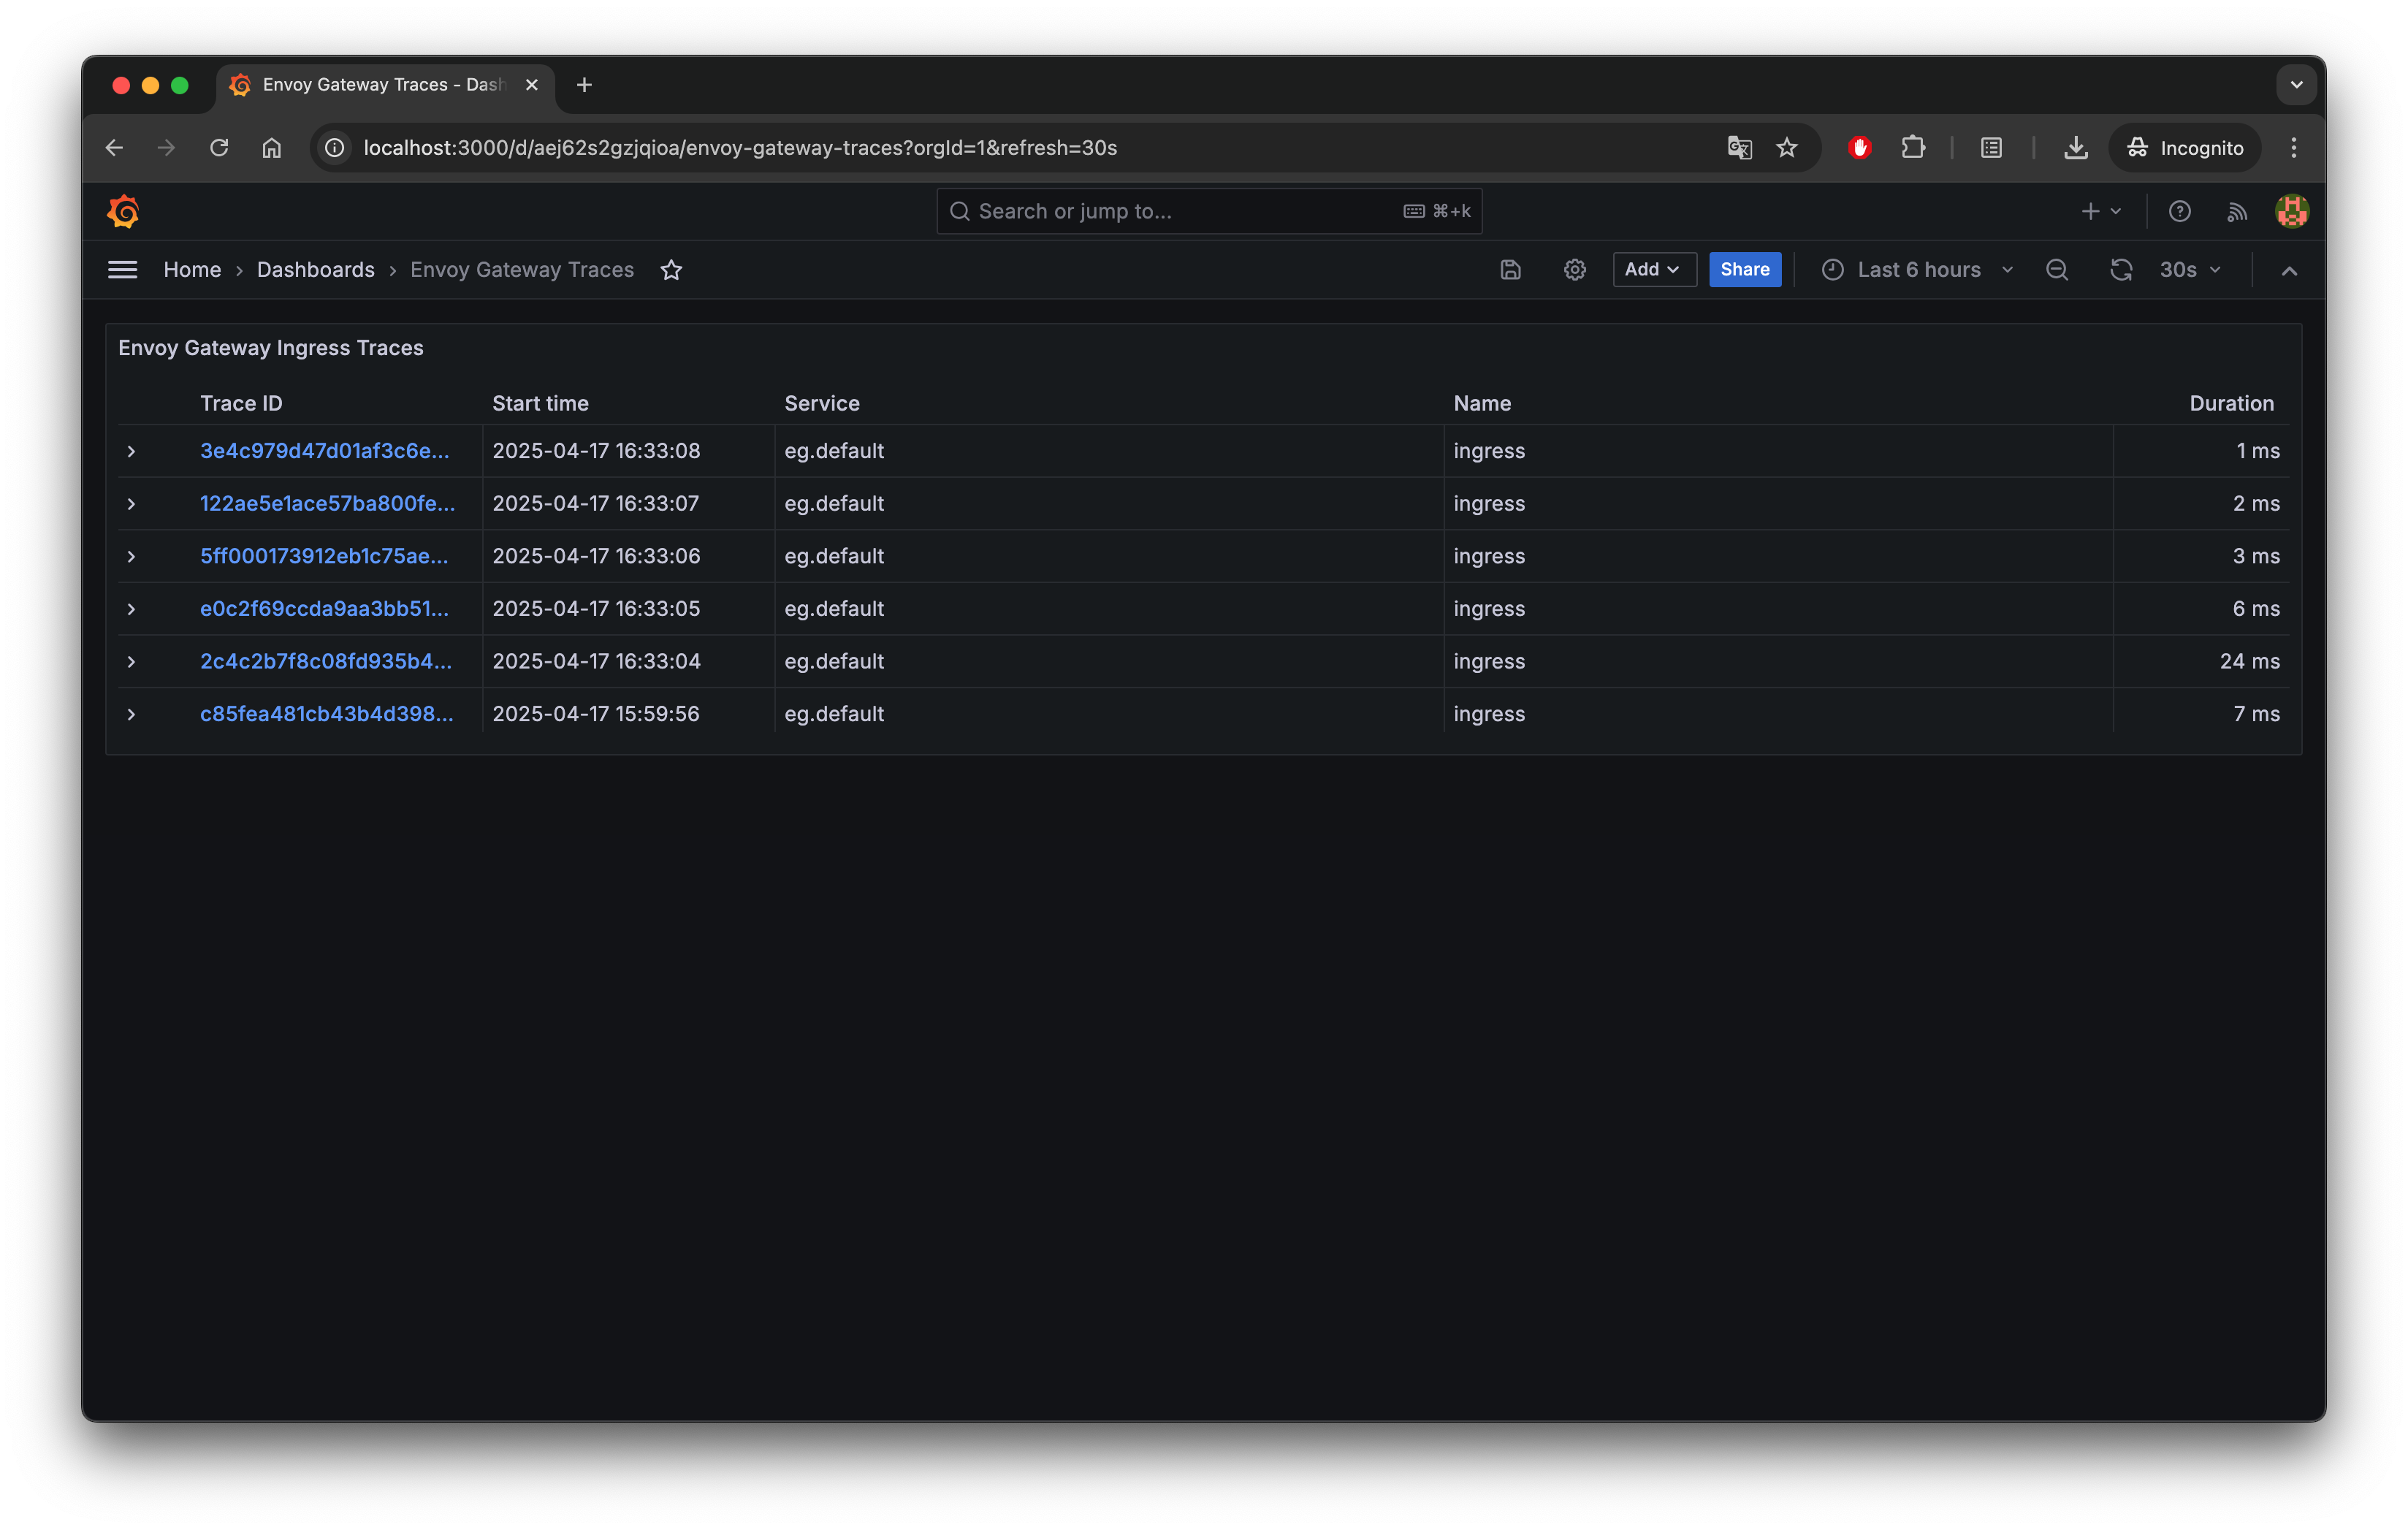
Click on any trace link to view its span details:
Conclusion
By following this guide, you can enable full observability for Envoy Gateway’s data plane, including metrics, logs, and traces. With OpenTelemetry Collector acting as a unified pipeline, and backend systems like Prometheus, Loki, and Tempo integrated, you gain a production-ready observability setup that helps troubleshoot issues, monitor traffic, and understand system behavior—all without modifying your applications. This foundation makes Envoy Gateway not just easier to operate, but also easier to trust.
References
- Proxy Metrics | Envoy Gateway
- Proxy Access Logs | Envoy Gateway
- Proxy Tracing | Envoy Gateway
- Visualising metrics using Grafana | Envoy Gateway
This blog was initially published at tetrate.io.