For a long time, I’ve wanted to examine my website content in a more intuitive, data-driven way. I wanted to know the annual creation frequency, popular categories and tags, and the coverage of Chinese and English content. To achieve this goal, I spent my weekend developing a brand new page for my website: the Content Analysis Dashboard .
This article will share the main features, build process, and technical implementation of this page, hoping to provide you with some interesting ideas.
Key Features
This analysis page is a completely client-side rendered single-page application that provides rich interactive charts and data filtering capabilities:
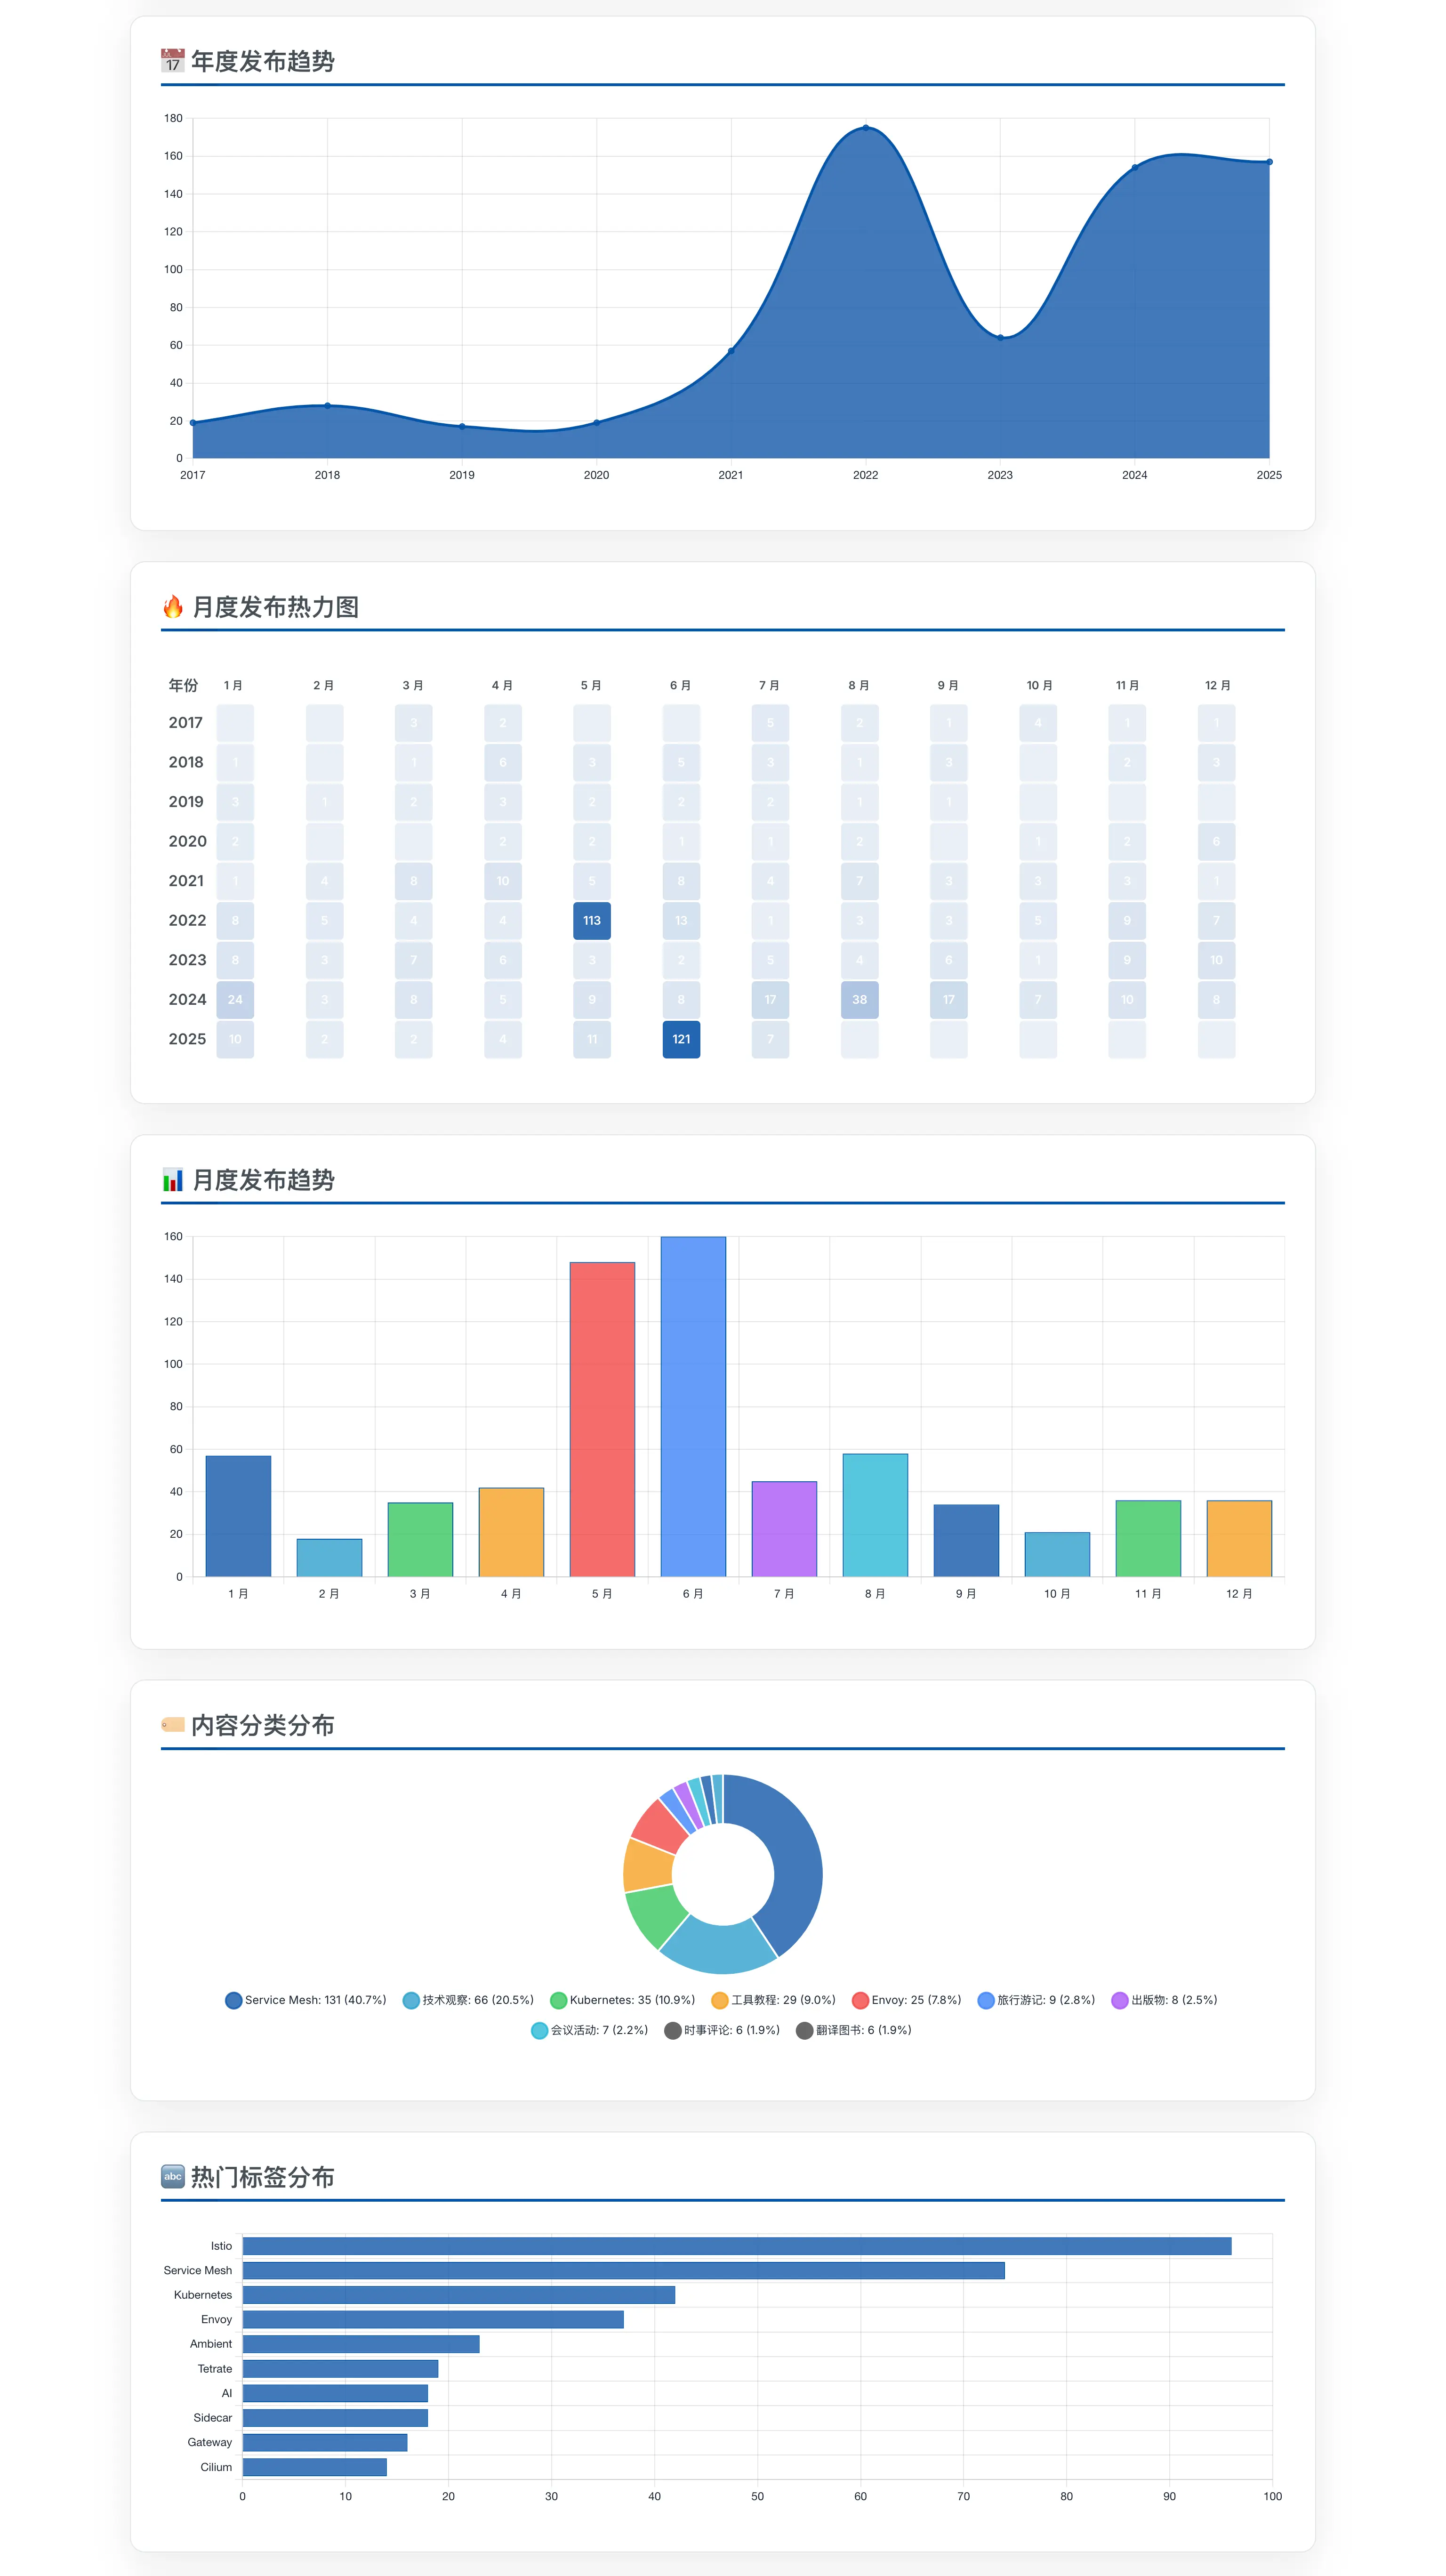
- Multi-dimensional Statistics: Displays core metrics such as total content count, language distribution, and average annual publications.
- Interactive Charts: Uses Chart.js to generate various charts including annual publication trends, monthly distribution, category and tag proportions.
- Publication Heatmap: Visually shows the creative activity for each month over the past few years.
- Data Filtering: Supports dynamic filtering by language, content type, year range, and categories, with all charts and data updating in real-time.
- Bilingual Content Analysis: Automatically detects and analyzes the correspondence and coverage between Chinese and English content.
- Tag Cloud and Content List: Convenient for quickly browsing popular topics and recently published content.
Architecture and Build Process
Considering the volume of website content, directly using Hugo’s jsonify to process all data would make the build process extremely slow and might even fail due to insufficient memory. Therefore, I designed an automated data processing workflow with front-end and back-end separation.

This workflow can be broken down into the following key steps:
Data Extraction: I wrote a Node.js script (
scripts/site/generate-analysis-data.js) that runs during website build. This script usesglobto scan all Markdown files in thecontent/directory and usesgray-matterto parse each file’s Front Matter, extracting metadata such as title, date, categories, and tags.Data Compression: The script consolidates all content metadata into a large JSON file. To optimize loading speed, the
build.jsscript calls thepakolibrary to compress this JSON file into Gzip format (content_analysis_data.json.gz), reducing file size by approximately 70-80%.Frontend Loading and Rendering: When the analysis page (
/analysis) loads, its JavaScript (assets/js/content-analysis-upload.js) asynchronously requests this.gzdata file. In the browser, it uses thepakolibrary again to decompress the data, then passes the parsed JSON data toChart.jsto dynamically render various charts.
This workflow cleverly bypasses Hugo’s build limitations, transferring the data processing pressure from build time to the client side, while ensuring good loading performance through data compression.
Conclusion
This content analysis page not only satisfies my curiosity about understanding my own creative content in depth but also serves as an interesting technical practice. Through data visualization, I can more clearly plan future creative directions. I invite you to visit my content analysis page for a hands-on experience, and I hope the implementation process of this project can provide you with some inspiration.