The Istio Telemetry API is a modern approach to replace traditional MeshConfig telemetry configuration. It provides more flexible tools to define Tracing, Metrics, and Access Logging within the service mesh. Compared to conventional EnvoyFilter and MeshConfig, the Telemetry API offers better modularity, dynamic updates, and multi-layered configuration capabilities.
In this article, we will detail how to use the Telemetry API to configure Istio telemetry features, covering the implementation of Tracing, Metrics, and Logging, as well as how to migrate from legacy MeshConfig configurations.
Evolution of Telemetry API
Istio’s telemetry capabilities initially relied on traditional methods such as Mixer and the configOverride in MeshConfig. While these methods met basic needs, they struggled with complex use cases. To address these issues, Istio introduced the CRD-based Telemetry API.
Key Version Updates
To help readers understand the evolution of the Telemetry API, here are some important version milestones:
- Istio 1.11: Introduced the Telemetry API (Alpha), offering basic metrics and logging customization.
- Istio 1.13: Added support for OpenTelemetry logging, custom tracing service names, and enhanced log filtering.
- Istio 1.18: Deprecated the installation of Prometheus
EnvoyFilter, relying entirely on Telemetry API for telemetry behavior. - Istio 1.22: Graduated the Telemetry API to stable (v1), making it ready for production environments.
Why Migrate to Telemetry API?
Although traditional MeshConfig and EnvoyFilter provided foundational telemetry capabilities, their configuration methods posed significant limitations in terms of flexibility, dynamism, and scalability. To better understand these limitations, let’s explore several key aspects.
Complexity of MeshConfig and EnvoyFilter
Before diving into the issues, let’s clarify the roles of MeshConfig and EnvoyFilter: MeshConfig is used for global configurations, while EnvoyFilter allows for fine-grained customization. However, this separation of duties leads to management challenges.
1. Dispersed Configuration Methods
MeshConfig is used to define global mesh behaviors, such as access log paths, trace sampling rates, and metric dimensions. While suitable for simple scenarios, it cannot meet namespace- or workload-specific needs.
EnvoyFilter can override or extend Envoy configurations, enabling finer control. However, this method involves directly manipulating Envoy’s internal structures (xDS fields), which is complex and error-prone.
Example: Configuring access logging via MeshConfig
apiVersion: install.istio.io/v1alpha1 kind: IstioOperator spec: meshConfig: accessLogFile: /dev/stdoutIssues:
- Cannot set different log paths for specific services or namespaces.
- Requires reapplying the entire configuration, lacking dynamism.
Example: Customizing metrics via EnvoyFilter
apiVersion: networking.istio.io/v1alpha3 kind: EnvoyFilter metadata: name: custom-metric-filter namespace: mynamespace spec: workloadSelector: labels: app: myapp configPatches: - applyTo: HTTP_FILTER match: context: SIDECAR_INBOUND listener: filterChain: filter: name: envoy.filters.network.http_connection_manager subFilter: name: envoy.filters.http.router proxy: proxyVersion: '^1\\.13.*' patch: operation: INSERT_BEFORE value: name: istio.stats typed_config: '@type': type.googleapis.com/udpa.type.v1.TypedStruct type_url: type.googleapis.com/envoy.extensions.filters.http.wasm.v3.Wasm value: config: configuration: '@type': type.googleapis.com/google.protobuf.StringValue value: | { "debug": "false", "stat_prefix": "istio", "disable_host_header_fallback": true } root_id: stats_inbound vm_config: code: local: inline_string: envoy.wasm.stats runtime: envoy.wasm.runtime.null vm_id: stats_inboundIssues:
- Syntax is complex and verbose, requiring deep understanding of Envoy’s structure.
- High potential for errors, leading to costly debugging and maintenance.
2. Lack of Dynamism
While modern microservice environments emphasize dynamic configuration, MeshConfig and EnvoyFilter offer limited support for dynamism:
- MeshConfig: Modifying configurations often requires restarting proxies or reapplying the entire setup, causing service disruptions.
- EnvoyFilter: Updating even a single parameter necessitates redeployment of related proxy instances.
3. Challenges in Multi-Tenant Support
In multi-tenant environments, customizing telemetry configurations for different namespaces or workloads is crucial. However:
- MeshConfig: Cannot provide differentiated settings for namespaces or workloads.
- EnvoyFilter: Requires multiple filter configurations, increasing management complexity.
4. Limited Extensibility and Debugging
- MeshConfig and EnvoyFilter are slow to support new requirements (e.g., OpenTelemetry).
- Debugging EnvoyFilter configurations is challenging, requiring in-depth analysis of Envoy logs and behaviors.
Deprecating Legacy MeshConfig Telemetry Configuration
Given the limitations mentioned above, the Istio community has deprecated traditional MeshConfig telemetry configurations. The following examples illustrate their usage and shortcomings:
Access Logging Configuration:
meshConfig:
  accessLogFile: /dev/stdout
Trace Sampling Configuration:
meshConfig:
  enableTracing: true
  extensionProviders:
  - name: zipkin
    zipkin:
      service: zipkin.istio-system.svc.cluster.local
      port: 9411
Custom Metrics Labels:
meshConfig:
  telemetry:
    v2:
      prometheus:
        configOverride:
          inboundSidecar:
            metrics:
              - name: requests_total
                dimensions:
                  user-agent: request.headers['User-Agent']
These configurations demonstrate clear limitations in flexibility and scalability, making them unsuitable for complex production environments.
Advantages of Telemetry API
Building upon traditional methods, the Telemetry API introduces several improvements, making it well-suited for modern service mesh management:
- Modular Design: Separate configurations for Tracing, Metrics, and Access Logging.
- Dynamic Updates: Supports real-time configuration updates without proxy restarts.
- Layered Support: Allows configurations at global, namespace, and workload levels.
- Simplified Syntax: Uses declarative syntax, eliminating the need for in-depth Envoy knowledge.
Example Configurations with Istio Telemetry API
Global Configuration Example
To illustrate the usage of the Telemetry API, here is an example of a global configuration:
apiVersion: telemetry.istio.io/v1alpha1
kind: Telemetry
metadata:
  name: mesh-default
  namespace: istio-system
spec:
  accessLogging:
    - providers:
        - name: file-log
  tracing:
    - providers:
        - name: "skywalking"
      randomSamplingPercentage: 100.00
  metrics:
    - overrides:
        - match:
            metric: REQUEST_COUNT
            mode: CLIENT
          tagOverrides:
            x_user_email:
              value: |
                'x-user-email' in request.headers ? request.headers['x-user-email'] : 'empty'
      providers:
        - name: prometheus
The remaining sections demonstrate step-by-step how to configure and validate SkyWalking, as well as perform migration, ensuring readers can implement these practices seamlessly in their environments.
Configuring SkyWalking with Telemetry API
Here, we will demonstrate how to use the Telemetry API to configure the sampling rate and span tags for SkyWalking.
Verify Istio Version and CRD
- If using Istio 1.22 or later, use
telemetry.istio.io/v1. - For Istio 1.18 to 1.21 users, use
telemetry.istio.io/v1alpha1.
Check whether the Telemetry API CRD is installed using the following command:
kubectl get crds | grep telemetry
Deploy SkyWalking
Deploy the SkyWalking OAP service in your cluster:
kubectl apply -f https://raw.githubusercontent.com/istio/istio/release-1.24/samples/addons/extras/skywalking.yaml
Check the service status:
kubectl get pods -n istio-system -l app=skywalking-oap
Add SkyWalking Provider to MeshConfig
Define the SkyWalking provider in Istio’s MeshConfig.
apiVersion: v1
kind: ConfigMap
metadata:
  name: istio
  namespace: istio-system
data:
  mesh: |-
    enableTracing: true
    extensionProviders:
    - name: "skywalking"
      skywalking:
        service: "tracing.istio-system.svc.cluster.local"
        port: 11800
Configure Sampling Rate with Telemetry API
Using the Telemetry API, set SkyWalking as the default tracing provider and define the sampling rate.
Telemetry API allows configuration at multiple levels. For brevity, we demonstrate namespace-level configuration here. For other levels, refer to the Telemetry API documentation.
apiVersion: telemetry.istio.io/v1
kind: Telemetry
metadata:
  name: namespace-override
  namespace: default
spec:
  tracing:
  - providers:
      - name: skywalking
    randomSamplingPercentage: 50
    customTags:
      env:
        literal:
          value: production
Explanation:
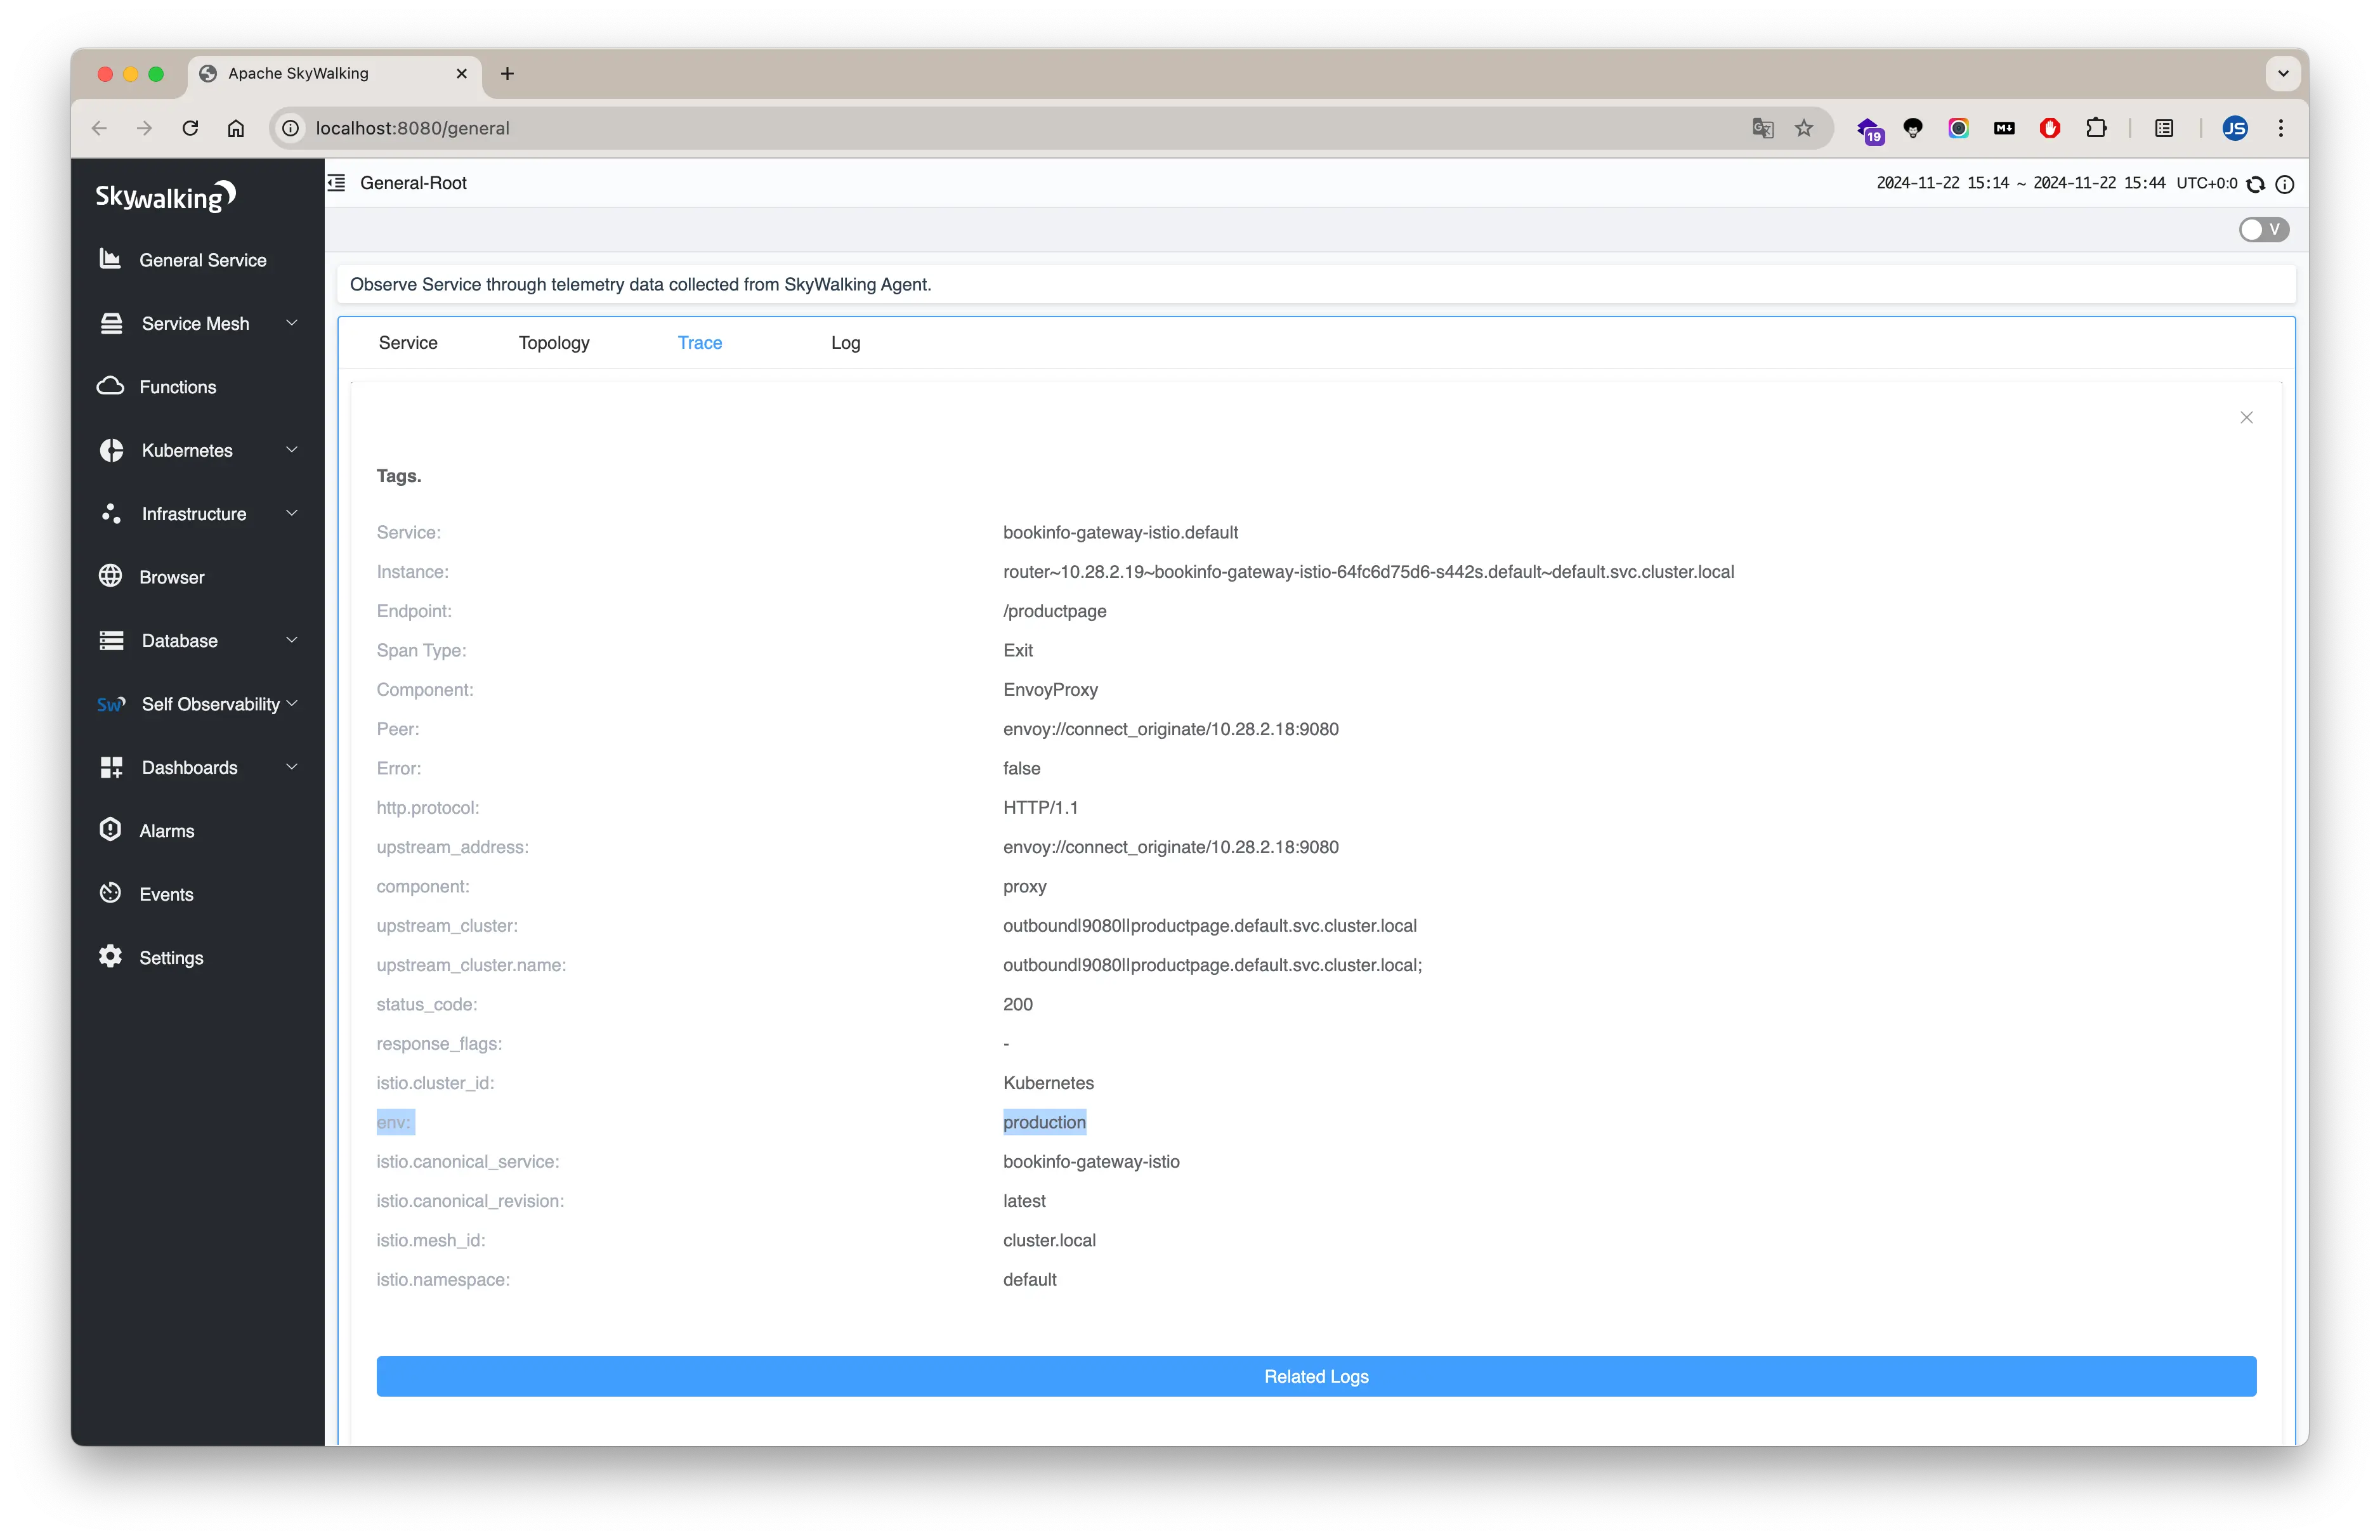
providers.name: Specifies SkyWalking as the default tracing provider.randomSamplingPercentage: Overrides namespace-level settings to set a 50% sampling rate.customTags: Adds theenv=productiontag to all trace data.
Validate Configuration
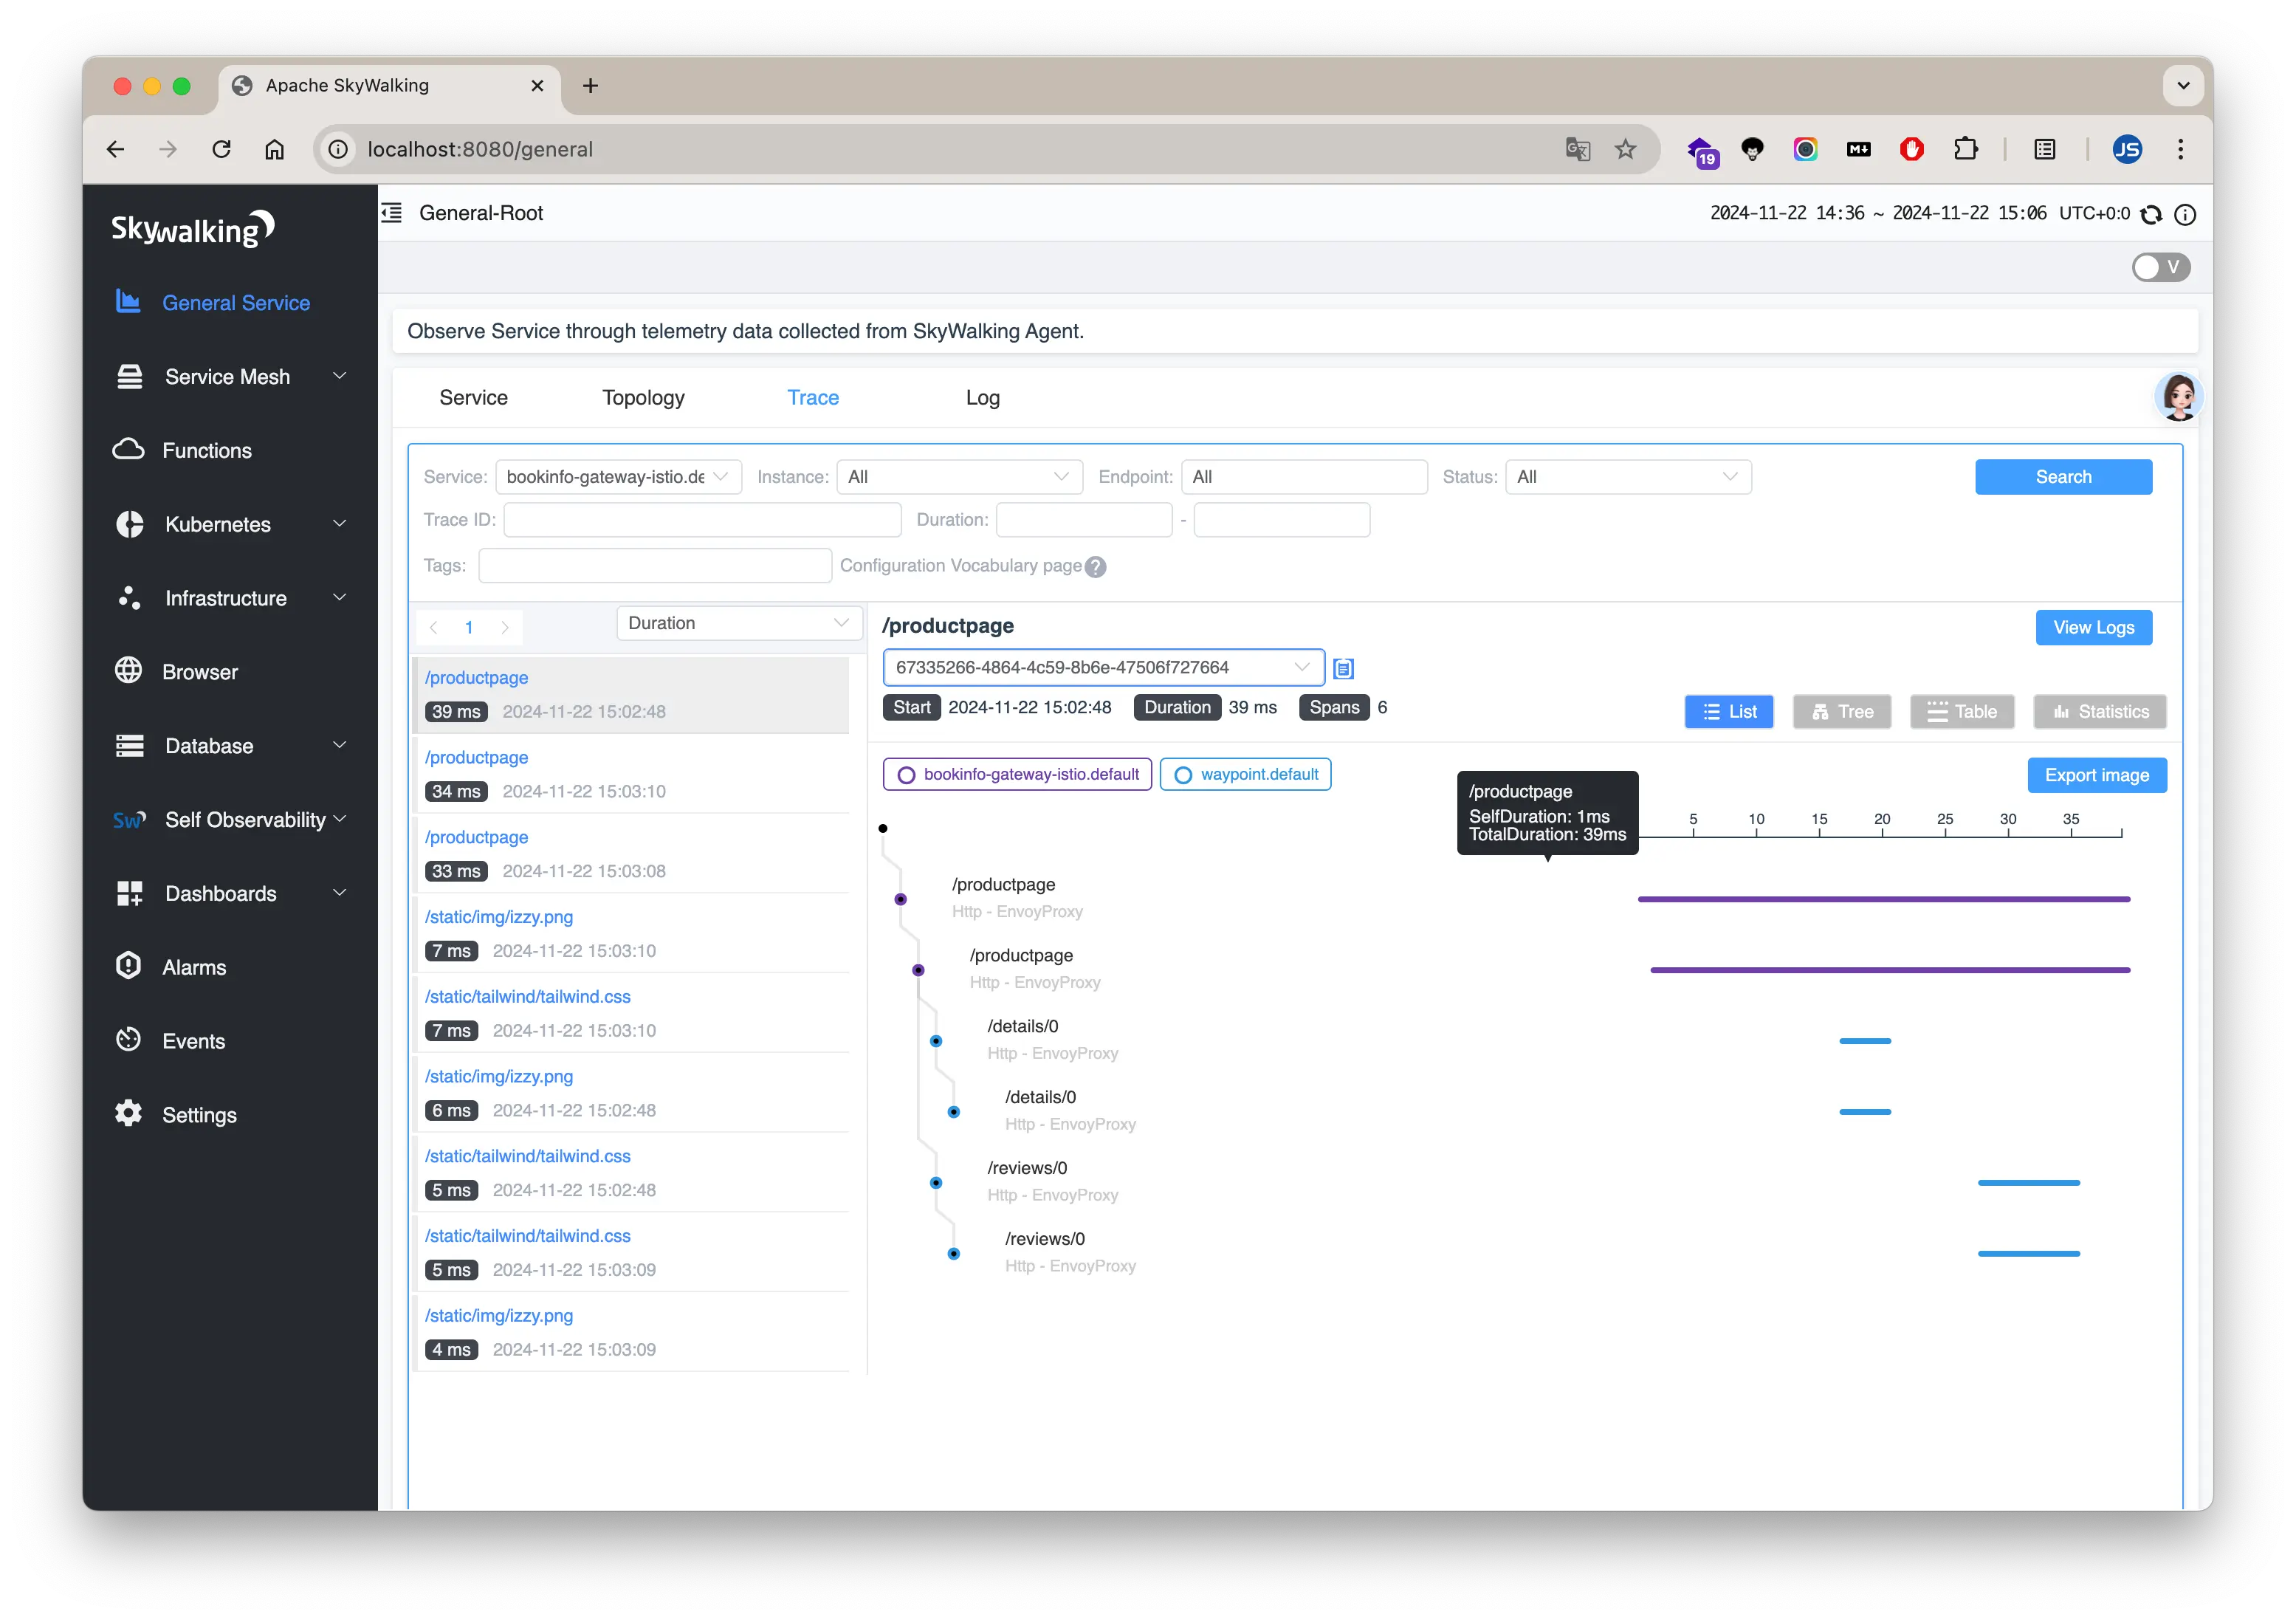
Generate traffic for the mesh services, such as using the Bookinfo example application:
curl http://$GATEWAY_URL/productpage
View the trace data:
istioctl dashboard skywalking
Open your browser and navigate to http://localhost:8080 to access the tracing dashboard and inspect the generated traces.

Click on a span to see the additional env: production tag.

Summary
The Telemetry API significantly reduces the complexity of configuring telemetry in the service mesh through its modular design, dynamic updates, and multi-level support. Compared to MeshConfig and EnvoyFilter, the Telemetry API is a more flexible, efficient, and modern solution. We highly recommend migrating to the Telemetry API to take full advantage of its capabilities.
This blog was initially published at tetrate.io.
